Unlock a world of possibilities! Login now and discover the exclusive benefits awaiting you.
- Qlik Community
- :
- All Forums
- :
- QlikView App Dev
- :
- Re: Adding a 3rd dimension into a bar chart
- Subscribe to RSS Feed
- Mark Topic as New
- Mark Topic as Read
- Float this Topic for Current User
- Bookmark
- Subscribe
- Mute
- Printer Friendly Page
- Mark as New
- Bookmark
- Subscribe
- Mute
- Subscribe to RSS Feed
- Permalink
- Report Inappropriate Content
Adding a 3rd dimension into a bar chart
Hello everyone,
I have the following situation:
A bar chart which displays the status "Green" or "Red" by Area:
(This chart has 2 dimensions: "Division" and "Status mês").
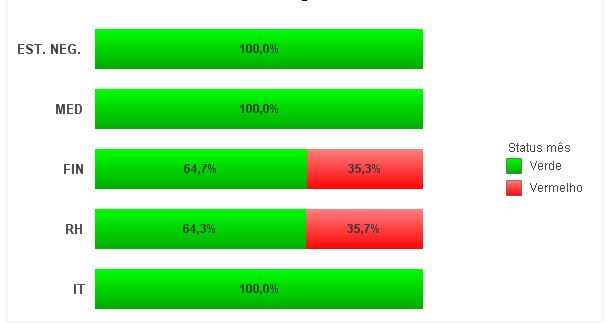
The expression of this chart calculate the percentage of Green and Red of each Division:
Count ([Status mês]) / Count (TOTAL <Division>[Status mês])
It was needed to apply a 3rd dimension called "Corporative", to display information that belongs to that dimension.
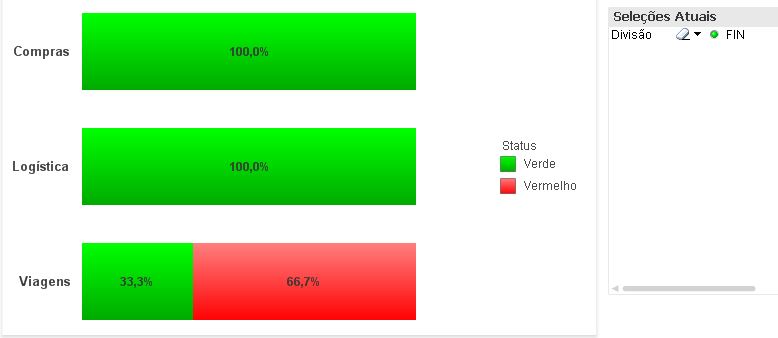
When i click in any bar of the chart, it displays all Areas which belongs to the Divison i clicked, for example:
After that 3rd dimension was included, the behavior of the filter is different.
When i click in the same Division "FIN", the chart displays only the green values, as you can see below:
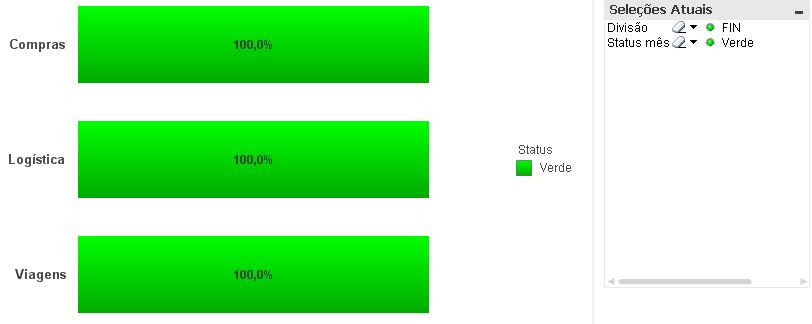
Why can i set the chart to don´t filter the green values?? I just want to show the red and green values from "FIN".
Anyone knows how can i fix this?
Regards
- Tags:
- new_to_qlikview
- Mark as New
- Bookmark
- Subscribe
- Mute
- Subscribe to RSS Feed
- Permalink
- Report Inappropriate Content
You selected Verde in the field Status mês. If you clear that selection you'll see both Status values again.
talk is cheap, supply exceeds demand
- Mark as New
- Bookmark
- Subscribe
- Mute
- Subscribe to RSS Feed
- Permalink
- Report Inappropriate Content
Hi Gysbert!
Thanks for your answer!
Thats the point. I didn´t selected "verde" in the field Status mês. I just clicked in the bar "FIN" inside the chart.
I know i can clear the selection, but i want to filter only the Division "FIN" when i click in the bar, and not the both values ("FIN" and "Verde"), exactly how it was before i add the 3rd dimension.
- Mark as New
- Bookmark
- Subscribe
- Mute
- Subscribe to RSS Feed
- Permalink
- Report Inappropriate Content
Can you post a qlikview document that demonstrates the problem? I suspect your bar chart doesn't contain three dimensions and one expression.
talk is cheap, supply exceeds demand
- Mark as New
- Bookmark
- Subscribe
- Mute
- Subscribe to RSS Feed
- Permalink
- Report Inappropriate Content
Yes, as sample would be helpful.
Are you using dimension groups?
- Mark as New
- Bookmark
- Subscribe
- Mute
- Subscribe to RSS Feed
- Permalink
- Report Inappropriate Content
Hey Guys,
I solved this problem by removing the 3rd diemension from the chart, and applying a trigger that set up this 3rd dimension as a filter when the app is started.
Thanks for your help and time.
Regards