Unlock a world of possibilities! Login now and discover the exclusive benefits awaiting you.
- Qlik Community
- :
- All Forums
- :
- QlikView App Dev
- :
- Re: Adding to Existing Dimension
- Subscribe to RSS Feed
- Mark Topic as New
- Mark Topic as Read
- Float this Topic for Current User
- Bookmark
- Subscribe
- Mute
- Printer Friendly Page
- Mark as New
- Bookmark
- Subscribe
- Mute
- Subscribe to RSS Feed
- Permalink
- Report Inappropriate Content
Adding to Existing Dimension
Hi all,
I am trying to add a new value in an existing dimension, I initially have this.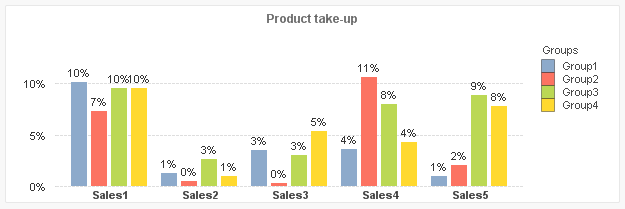
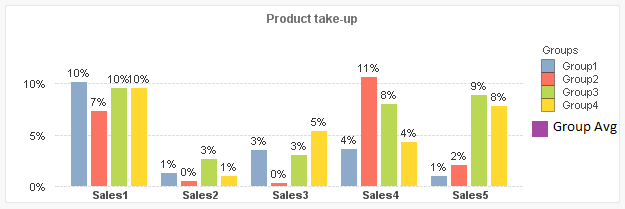
I want to have an extra Bar called group avg in all the sales column.
Please see the attached qvw to understand the situation better and I am source the way I have it in the back end.
- Tags:
- dimension
Accepted Solutions
- Mark as New
- Bookmark
- Subscribe
- Mute
- Subscribe to RSS Feed
- Permalink
- Report Inappropriate Content
- Mark as New
- Bookmark
- Subscribe
- Mute
- Subscribe to RSS Feed
- Permalink
- Report Inappropriate Content
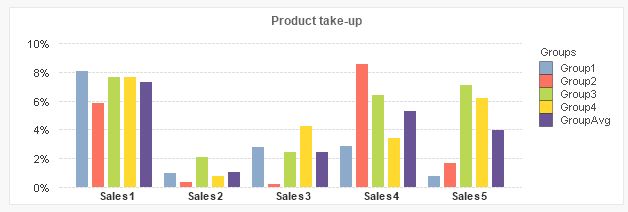
One possible solution-way attached.
- Mark as New
- Bookmark
- Subscribe
- Mute
- Subscribe to RSS Feed
- Permalink
- Report Inappropriate Content
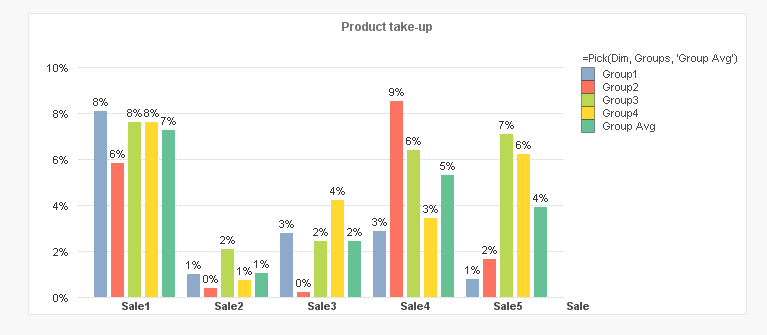
Another option is to use CrossTable Load like this
Sale:
CrossTable(Sale, Value)
LOAD * INLINE [
Groups, Sale1, Sale2, Sale3, Sale4, Sale5
Group1, 0.79759424, 0.09878233, 0.274495397, 0.283752506, 0.077262074
Group2, 0.572974879, 0.037239144, 0.021465945, 0.838789364, 0.160991477
Group3, 0.750333678, 0.204238937, 0.239284092, 0.631995441, 0.698577191
Group4, 0.751788678, 0.073845562, 0.418150331, 0.338250451, 0.611715877
];
And then add an Island Table like this
Dim:
LOAD * Inline [
Dim
1
2
];
Dimension
Sale
=Pick(Dim, Groups, 'Group Avg')
Expression
=Pick(Dim, Sum(Value), Avg(Value))
- Mark as New
- Bookmark
- Subscribe
- Mute
- Subscribe to RSS Feed
- Permalink
- Report Inappropriate Content
Thanks,
I am pleased. tresesco
- Mark as New
- Bookmark
- Subscribe
- Mute
- Subscribe to RSS Feed
- Permalink
- Report Inappropriate Content
stalwar1
Welcome back, it's been a while since I saw you active on community.