Unlock a world of possibilities! Login now and discover the exclusive benefits awaiting you.
- Qlik Community
- :
- All Forums
- :
- QlikView App Dev
- :
- Re: Adjusting a Reference Line
- Subscribe to RSS Feed
- Mark Topic as New
- Mark Topic as Read
- Float this Topic for Current User
- Bookmark
- Subscribe
- Mute
- Printer Friendly Page
- Mark as New
- Bookmark
- Subscribe
- Mute
- Subscribe to RSS Feed
- Permalink
- Report Inappropriate Content
Adjusting a Reference Line
Expert Community. I am trying to figure out how to write an expression in the Reference Line area where I can adjust a reference line from one value to another mid year. My example is a simple bar chart. I have a bar chart with 13 months (e.g. Nov 14 to Nov 15) where each bar references a value. I have a goal line set at let's say 65%. Beginning halfway through the year the goal line has been adjusted to let's say 75%. How do I write an expression showing the goal line moving from 65% for the first 6 months and then going to the new limit for the remaining 7 months?
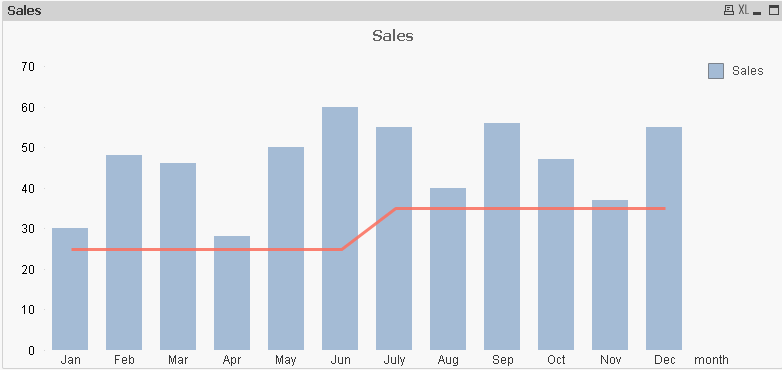
Here is an example using a Excel image.

- Mark as New
- Bookmark
- Subscribe
- Mute
- Subscribe to RSS Feed
- Permalink
- Report Inappropriate Content
i don't think so . Can you just use a combo chart with a bar measure and a line measure ?
- Mark as New
- Bookmark
- Subscribe
- Mute
- Subscribe to RSS Feed
- Permalink
- Report Inappropriate Content
you can conditionally hide the reference line.
not sure how it helps here though
Regards
Sri1
- Mark as New
- Bookmark
- Subscribe
- Mute
- Subscribe to RSS Feed
- Permalink
- Report Inappropriate Content
Go ahead nd use combo chart you can achived this by writing 2 expressions first expression will be showing your data in bar chart and use second expression for refrence line.
for first expression display option in the expression tab should be bar and for the scond expression it should be line.
for example:
1st exp sum(Sales)
2nd exp sum(if([Month Num]<=6,25,35))
Hope this will help you........!!
Regards,
Sandip Satbhai