Unlock a world of possibilities! Login now and discover the exclusive benefits awaiting you.
- Qlik Community
- :
- All Forums
- :
- QlikView App Dev
- :
- Re: Aggr Function
- Subscribe to RSS Feed
- Mark Topic as New
- Mark Topic as Read
- Float this Topic for Current User
- Bookmark
- Subscribe
- Mute
- Printer Friendly Page
- Mark as New
- Bookmark
- Subscribe
- Mute
- Subscribe to RSS Feed
- Permalink
- Report Inappropriate Content
Aggr Function
Hi All, could you please help me out with this expression where i am going wrong.
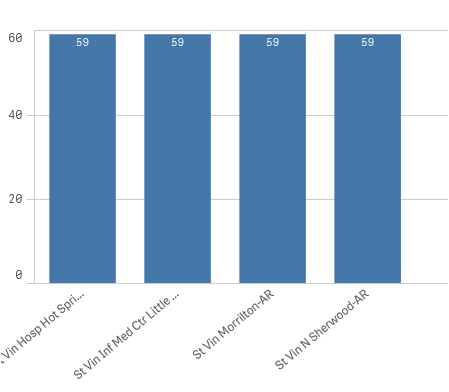
In the chart it show the same values that is not expected.
=count(Aggr(if($(=num(count( {<TopBox={'1'},FiscalYear={'2018'}>}SRID)/count( {<FiscalYear={'2018'}>}SRID),'#.00000'))>=percent1,QuestionLabel),percent1,QuestionLabel,FACILITY,Srnumber1))
- Mark as New
- Bookmark
- Subscribe
- Mute
- Subscribe to RSS Feed
- Permalink
- Report Inappropriate Content
Are you intentionally aggregating on percent1,QuestionLabel,FACILITY,Srnumber1, because they're not a dimension (w/the exception of FACILITY)?
I'm thinking you've aggregated w/too many fields. You can try removing one aggregation at a time and see if your values change.
HTH,
Jason
- Mark as New
- Bookmark
- Subscribe
- Mute
- Subscribe to RSS Feed
- Permalink
- Report Inappropriate Content
Actually those are all Dimension field.
I have to aggregated it those level i think there is problem with dollar expansion in Aggr function.
- Mark as New
- Bookmark
- Subscribe
- Mute
- Subscribe to RSS Feed
- Permalink
- Report Inappropriate Content
How about this? I am assuming percent1 is not the field?
=count(Aggr(if(num(count( {<TopBox={'1'},FiscalYear={'2018'}>}SRID)/count( {<FiscalYear={'2018'}>}SRID),'#.00000')>=percent1,QuestionLabel),percent1,QuestionLabel,FACILITY,Srnumber1))
- Mark as New
- Bookmark
- Subscribe
- Mute
- Subscribe to RSS Feed
- Permalink
- Report Inappropriate Content
Hi Lohit, dollar expansion is processed before the table is calculated, so the stepsa are: this dollar expansion is calculated, returns a number, and this number replace the dollar expansion in expression, so all dimensions uses the same numbers, ie:
=count(Aggr(if(0.8>=percent1,QuestionLabel),percent1,QuestionLabel,FACILITY,Srnumber1)) // 0.8 just as an example of how the expression is expanded.
Anil expression below should work.
- Mark as New
- Bookmark
- Subscribe
- Mute
- Subscribe to RSS Feed
- Permalink
- Report Inappropriate Content
Sorry, I wasn't clear. Yes, they are dimensions, just not dimensions in the chart you're referencing. I initially thought your were forcing aggregation outside of the chart dimensions.