Unlock a world of possibilities! Login now and discover the exclusive benefits awaiting you.
- Qlik Community
- :
- All Forums
- :
- QlikView App Dev
- :
- Aggr Issue
- Subscribe to RSS Feed
- Mark Topic as New
- Mark Topic as Read
- Float this Topic for Current User
- Bookmark
- Subscribe
- Mute
- Printer Friendly Page
- Mark as New
- Bookmark
- Subscribe
- Mute
- Subscribe to RSS Feed
- Permalink
- Report Inappropriate Content
Aggr Issue
Hi All,
I have a table like below
| Region | ID | BUU | BenefitFlag | Sales |
| America | A | ISS | 0 | 100 |
| America | A | BCS | 1 | 200 |
| America | A | HPN | 0 | 500 |
| America | B | ISS | 1 | 300 |
| America | B | TS | 1 | 500 |
| America | B | Storage | 0 | 600 |
My Output table (Pivot) has two expressions.
1. =sum(aggr(sum({<BenefitFlag = {1}>}Sales), BUU, ID)) - Sales with benefits
2. =sum(aggr(sum({<BenefitFlag -= {1}>}Sales), BUU, ID)) - Sales without benefits
Output table when no selection made
| Region | with_Benefit | without_Benefit |
| America | 1000 | 1200 |
When I select BUU only (any one BUU)
eg. ISS is selected
| Region | with_Benefit | without_Benefit |
| America | 300 | 200 |
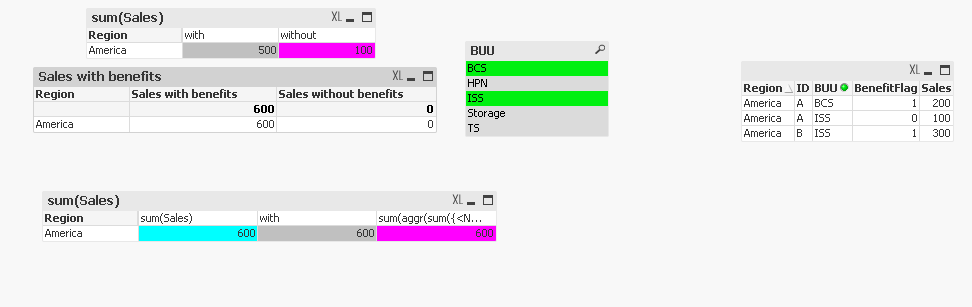
When I select More than one BUU for eg. I selected ISS and BCS
My output comes like below
| Region | with_Benefit | without_Benefit |
| America | 500 | 100 |
But my requirement is to get 600 in with_benefit and 0 in without benefit.
| Region | with_Benefit | without_Benefit |
| America | 600 | 0 |
Actually when you select ISS and BCS, look at the total of the BenefitFlag = 1 (0+1) for the ID A so that 100 also should come in with_Benefit bucket.
Any idea. ?
Thanks
Renji
Accepted Solutions
- Mark as New
- Bookmark
- Subscribe
- Mute
- Subscribe to RSS Feed
- Permalink
- Report Inappropriate Content
Try these
with
If(GetSelectedCount(BUU) = 0, Sum({<BenefitFlag = {1}>}Sales), Sum({<ID = {"=Sum(BenefitFlag) > 0"}>} Sales))
without
If(GetSelectedCount(BUU) = 0, Sum({<BenefitFlag -= {1}>}Sales), Sum({<ID = {"=Sum(BenefitFlag) = 0"}>} Sales))
- Mark as New
- Bookmark
- Subscribe
- Mute
- Subscribe to RSS Feed
- Permalink
- Report Inappropriate Content
Try to use indirect set analysis using P() and E()
Sales with benefits
=sum(aggr(sum({<Region = p({<BenefitFlag = {1}>})>}Sales), BUU, ID))
Sales without benefits
=sum(aggr(sum({<Region = E({<BenefitFlag = {1}>})>}Sales), BUU, ID))
Qlik Community MVP
- Mark as New
- Bookmark
- Subscribe
- Mute
- Subscribe to RSS Feed
- Permalink
- Report Inappropriate Content
Would you be able to share some other expected results for other selection? I am guessing that ISS and BCS are not unique which require a particular kind of results. It would be helpful to understand the logic behind your expected result for different selections
- Mark as New
- Bookmark
- Subscribe
- Mute
- Subscribe to RSS Feed
- Permalink
- Report Inappropriate Content
Here i am selecting ISS, HPN and Storage,
Inputtable after selection
| Region | ID | BUU | BenefitFlag | Sales |
| America | A | ISS | 0 | 100 |
| America | A | HPN | 0 | 500 |
| America | B | ISS | 1 | 300 |
| America | B | Storage | 0 | 600 |
So from the above table if you look at ID B, the sum of BenefitFlag is greater than 0 (1+0) and sum of BenefitFlag for ID A is equal to 0 (0 + 0).
if its greater than 0, then sum the sales (600 +300) and will be in the Sales_with_Benefit bucket, else, 500 +100 will be in the without bucket.
So my output should be like below
| Region | with | without |
| America | 900 | 600 |
thanks for your help.. 
- Mark as New
- Bookmark
- Subscribe
- Mute
- Subscribe to RSS Feed
- Permalink
- Report Inappropriate Content
Try these
with
If(GetSelectedCount(BUU) = 0, Sum({<BenefitFlag = {1}>}Sales), Sum({<ID = {"=Sum(BenefitFlag) > 0"}>} Sales))
without
If(GetSelectedCount(BUU) = 0, Sum({<BenefitFlag -= {1}>}Sales), Sum({<ID = {"=Sum(BenefitFlag) = 0"}>} Sales))
- Mark as New
- Bookmark
- Subscribe
- Mute
- Subscribe to RSS Feed
- Permalink
- Report Inappropriate Content
Bingo..!!