Unlock a world of possibilities! Login now and discover the exclusive benefits awaiting you.
- Qlik Community
- :
- All Forums
- :
- QlikView App Dev
- :
- Re: Aggr function
- Subscribe to RSS Feed
- Mark Topic as New
- Mark Topic as Read
- Float this Topic for Current User
- Bookmark
- Subscribe
- Mute
- Printer Friendly Page
- Mark as New
- Bookmark
- Subscribe
- Mute
- Subscribe to RSS Feed
- Permalink
- Report Inappropriate Content
Aggr function
Hello can you tell me how does the aggr function works?
in this case aggr(sum(Sales), Country)
what is generated?
Thanks
Marco
- « Previous Replies
-
- 1
- 2
- Next Replies »
Accepted Solutions
- Mark as New
- Bookmark
- Subscribe
- Mute
- Subscribe to RSS Feed
- Permalink
- Report Inappropriate Content
Hi
Please have a look at the attachement.
Basically selected the dimension Prodotto and an expression columns called aggrgate which has the formula Aggr(Sum(Valori),Prodotto)
Sasi
- Mark as New
- Bookmark
- Subscribe
- Mute
- Subscribe to RSS Feed
- Permalink
- Report Inappropriate Content
You will get 0, 1 or more values. Each value is grouped by Country and the value is the sum of Sales for that particular country.
That is why you do safest in wrapping your Aggr() in an aggregate function to do something about the multiple values that might be returned.
- Mark as New
- Bookmark
- Subscribe
- Mute
- Subscribe to RSS Feed
- Permalink
- Report Inappropriate Content
It is like creating a straight table with Country as dimension and sum(Sales) as expression.
That is why many values are returned.
Usually it is combined with some other function like RangeSum, so that QlikView knows which value to show from the many returned.
- Mark as New
- Bookmark
- Subscribe
- Mute
- Subscribe to RSS Feed
- Permalink
- Report Inappropriate Content
like in SQL
select sum(Sales), Country from ..... group by Country
QlikView help
aggr ([ distinct | nodistinct ] [{set_expression}]expression {, dimension})
Returns a set of values of expression calculated over dimensions. The result can be compared to the expression column of a 'local chart', evaluated in the context where the aggr function resides. Each dimension must be a single field. It cannot be an expression (calculated dimension).
If the expression argument is preceded by the nodistinct qualifier, each combination of dimension values may generate more than one return value, depending on underlying data structure. If the expression argument is preceded by the distinct qualifier or if no qualifier is used at all, each combination of dimension values will generate only one return value.
- Mark as New
- Bookmark
- Subscribe
- Mute
- Subscribe to RSS Feed
- Permalink
- Report Inappropriate Content
How can i test (to display the list of values) in a text box the structure of Aggr function as you have said?
Thanks
Marco
- Mark as New
- Bookmark
- Subscribe
- Mute
- Subscribe to RSS Feed
- Permalink
- Report Inappropriate Content
=concat (aggr(sum(Sales), Country) , chr(10))
- Mark as New
- Bookmark
- Subscribe
- Mute
- Subscribe to RSS Feed
- Permalink
- Report Inappropriate Content
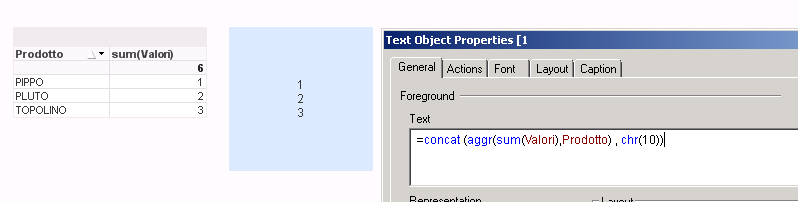
If i use the statement with these datas:
Prodotto Valori
PIPPO 1
PLUTO 2
TOPOLINO 3
What should i get with this statement concat (aggr(Prodotto,sum(Valori)) , chr(10)) ?
If i try i get error: Nested aggregation not allowed,
If i try with the inverted expression (aggr(sum(Valori),Prodotto) , chr(10)) i get only numbers is it correct?
Thanks
Marco
- Mark as New
- Bookmark
- Subscribe
- Mute
- Subscribe to RSS Feed
- Permalink
- Report Inappropriate Content
expression in textbox is
=concat (aggr(sum(Valori),Prodotto) , chr(10))
chr(10) is the separator (line feed), change with ' ' if you want all the values on the same line
- Mark as New
- Bookmark
- Subscribe
- Mute
- Subscribe to RSS Feed
- Permalink
- Report Inappropriate Content
So the product name is not showed within the aggr function?
Marco
- Mark as New
- Bookmark
- Subscribe
- Mute
- Subscribe to RSS Feed
- Permalink
- Report Inappropriate Content
maybe
=concat (aggr(Prodotto & ' ' & sum(Valori),Prodotto) , ' - ')
- « Previous Replies
-
- 1
- 2
- Next Replies »