Unlock a world of possibilities! Login now and discover the exclusive benefits awaiting you.
- Qlik Community
- :
- All Forums
- :
- QlikView App Dev
- :
- Aggr function?
- Subscribe to RSS Feed
- Mark Topic as New
- Mark Topic as Read
- Float this Topic for Current User
- Bookmark
- Subscribe
- Mute
- Printer Friendly Page
- Mark as New
- Bookmark
- Subscribe
- Mute
- Subscribe to RSS Feed
- Permalink
- Report Inappropriate Content
Aggr function?
Hi,
I have following table:
X,Y
A,1
A,2
A,3
B,1
B,2
C,2
C,3
The result that I am looking for is an aggregation/subtotal in every row in a new column:
X,Y,Z
A,1,6
A,2,6
A,3,6
B,1,3
B,2,3
C,2,5
C,3,5
Furhtermore I am looking for the calculation of the shares:
X;Y;Z;XY
A;1;6;0,16
A;2;6;0,33
A;3;6;0,5
B;1;3;0,33
B;2;3;0,66
...
Could somebody please help me solving this issue?
Thank you verry much.
Kind regards,
Andi.
- Mark as New
- Bookmark
- Subscribe
- Mute
- Subscribe to RSS Feed
- Permalink
- Report Inappropriate Content
You don't need to change the script at all. And you don't need an Aggr() function or Set analysis. Just load your initial data and then make a chart like this:
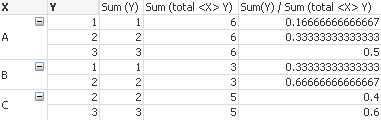
HIC
- Mark as New
- Bookmark
- Subscribe
- Mute
- Subscribe to RSS Feed
- Permalink
- Report Inappropriate Content
Thanks a lot for your help.
I am almost there.
In my case the table looks now like this.
The problem is that a wagon number appears more than once depending on the date. What kind of formula do I need to sum "Länge" for the separate dates?
60, 20, 40 and not 120.
I need 2 criteria: "Waggonnr." and "Übernahmedatum"
Thank you.
- Mark as New
- Bookmark
- Subscribe
- Mute
- Subscribe to RSS Feed
- Permalink
- Report Inappropriate Content
Sum(total <Übernahmedatum,Wagonnr.> Länge)
HIC