Unlock a world of possibilities! Login now and discover the exclusive benefits awaiting you.
- Qlik Community
- :
- All Forums
- :
- QlikView App Dev
- :
- Re: Aggregate & Upper Quartile Help
- Subscribe to RSS Feed
- Mark Topic as New
- Mark Topic as Read
- Float this Topic for Current User
- Bookmark
- Subscribe
- Mute
- Printer Friendly Page
- Mark as New
- Bookmark
- Subscribe
- Mute
- Subscribe to RSS Feed
- Permalink
- Report Inappropriate Content
Aggregate & Upper Quartile Help
Hi,
In the attached sample app I have the following straight table :
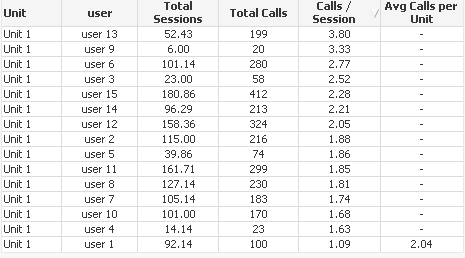
I 'think' I have calculated the 'AVG Calls per Unit' correctly by using an aggregate function. Is there any reason why it is only showing in one cell?
Also, I need to create another expression where I need to calculate if each User carried out at least the average number of Calls for the unit - how many more calls could be made for this particular Unit.
Following on from this. If each user carried out the total calls per session at least equal to the upper quartile (top 5) of users how many more calls could be made ?
Any help or advice on this is greatly appreciated.
Many thanks!
- Mark as New
- Bookmark
- Subscribe
- Mute
- Subscribe to RSS Feed
- Permalink
- Report Inappropriate Content
Once again this has worked like a dream!! many thanks.
One very utmost final request...  ...
...
in the example below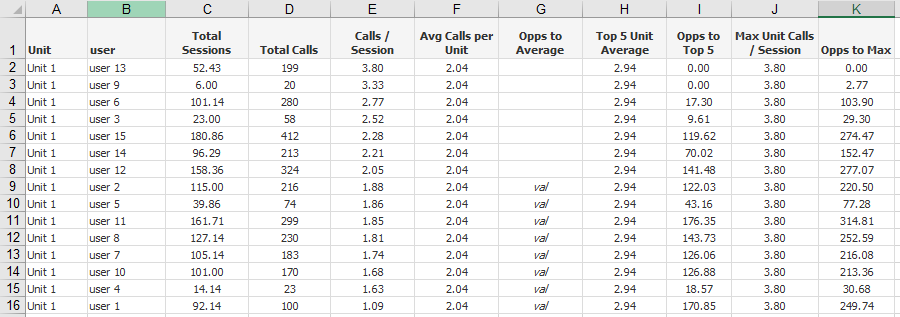
is it possible to add a column similar to the .Opps to Top 5' where if the call/session is below the unit average it shows what could be achieved if every user aimed for the average (Col g)?
Also, can a column (J) be added to show the average of the TOP 5 for the unit for comparison values.?
Once again, I cant thank you enough for your help!
- Mark as New
- Bookmark
- Subscribe
- Mute
- Subscribe to RSS Feed
- Permalink
- Report Inappropriate Content
Here you are

- Mark as New
- Bookmark
- Subscribe
- Mute
- Subscribe to RSS Feed
- Permalink
- Report Inappropriate Content
excellent! Many thanks again for your expertise.!
- Mark as New
- Bookmark
- Subscribe
- Mute
- Subscribe to RSS Feed
- Permalink
- Report Inappropriate Content
Not a problem 
Best,
Sunny
- Mark as New
- Bookmark
- Subscribe
- Mute
- Subscribe to RSS Feed
- Permalink
- Report Inappropriate Content
Hi Sunny,
Sorry to bother you again on this ... is there a way to create a 'median' calls per unit ?
Many thanks again,
TJM
- Mark as New
- Bookmark
- Subscribe
- Mute
- Subscribe to RSS Feed
- Permalink
- Report Inappropriate Content
May be this?
=Median(TOTAL <Unit> total_calls/total_sessions)
- Mark as New
- Bookmark
- Subscribe
- Mute
- Subscribe to RSS Feed
- Permalink
- Report Inappropriate Content
Outstanding - perfect!
TJM
- Mark as New
- Bookmark
- Subscribe
- Mute
- Subscribe to RSS Feed
- Permalink
- Report Inappropriate Content
Hi again,
Hope you can advise on this? Just wondering if it is possible to show the following? 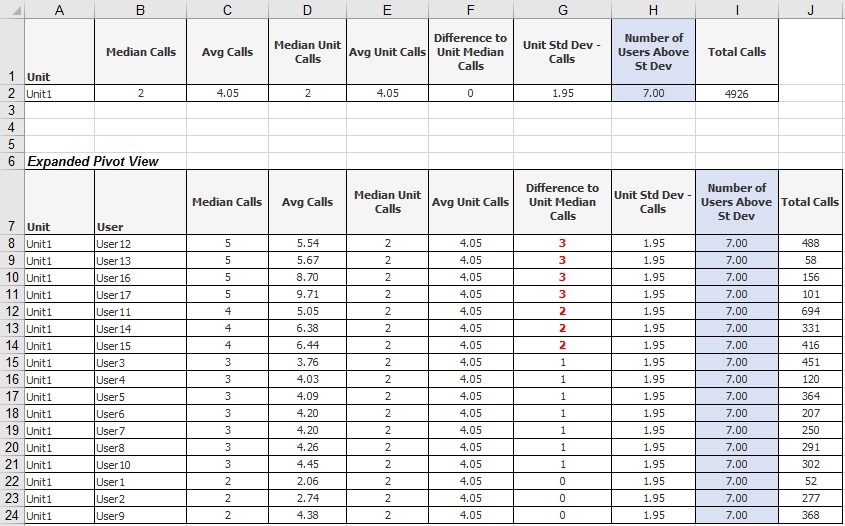
Basically, I need to have an expression that counts the number of users whose 'Median Number of Calls' are above the Standard Deviation for the Unit (Column H in the above mock up and column I in the 'expanded' view)
Once again, many thanks for your time.!
TJM
- Mark as New
- Bookmark
- Subscribe
- Mute
- Subscribe to RSS Feed
- Permalink
- Report Inappropriate Content
Can you share an update app where you have calculated the standard deviation? I am not sure how you got 1.96
- Mark as New
- Bookmark
- Subscribe
- Mute
- Subscribe to RSS Feed
- Permalink
- Report Inappropriate Content
Hi Sunny,
I attached a new sample QV document and also an excel sheet of what I'm trying to achieve.
Basically, I need to show how many users per unit are are over the median call time (column F in the image below) for each unit (we have decided to use median rather than mean). I then need to show what savings (in the form of extra calls handled) could be made per unit, if each user aimed for the median call time for their unit (column G in the image below):
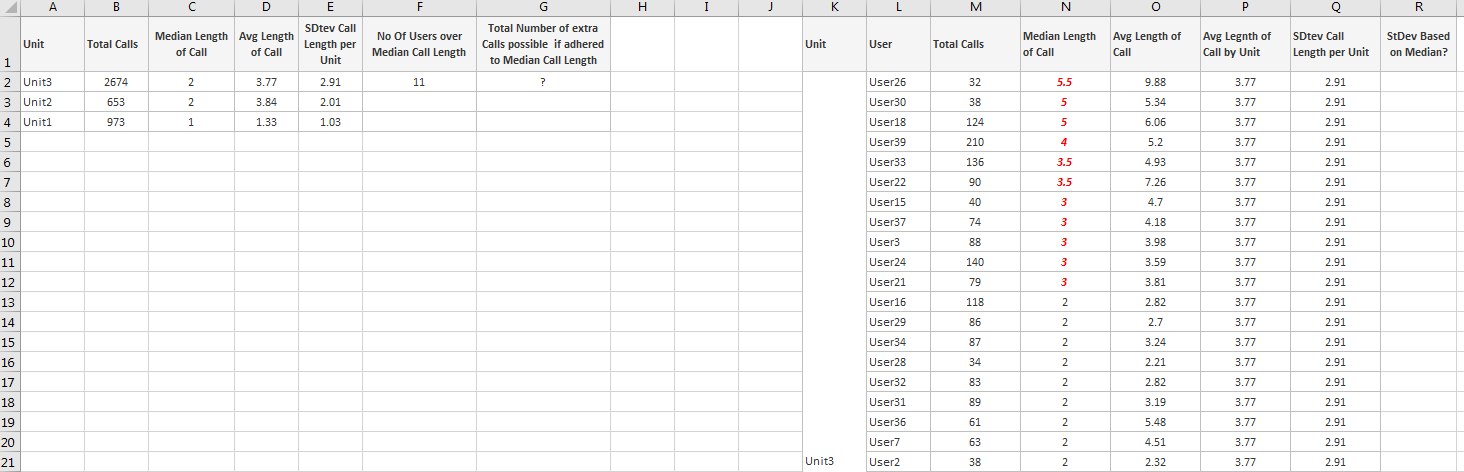
I have tried to include a Standard Deviation per Unit - although as we are trying to work to Median LOS I'm not sure we can have a StDev for a Median?? Any thoughts on this.
Although this example is in Qlikview and the moment - we hope to implement it in QlikSense too.
Once again your time and expertise is highly appreciated!
TJM