Unlock a world of possibilities! Login now and discover the exclusive benefits awaiting you.
- Qlik Community
- :
- All Forums
- :
- QlikView App Dev
- :
- Aggregate chart expression problem
- Subscribe to RSS Feed
- Mark Topic as New
- Mark Topic as Read
- Float this Topic for Current User
- Bookmark
- Subscribe
- Mute
- Printer Friendly Page
- Mark as New
- Bookmark
- Subscribe
- Mute
- Subscribe to RSS Feed
- Permalink
- Report Inappropriate Content
Aggregate chart expression problem
Hi,
I am having trouble with aggregation of chart expressions.
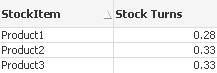
My client wants a table that displays Stock Turns by StockItem. The calculation for this is CostOfSales/CostOnHand. It is normally a value between 0 and 1 (eg 0.12).
The data is stored in a StockPeriod table, which gives us those two values for every StockItem, Location and Month.
For example:
StockPeriod:
LOAD * Inline [
MonthStart,StockItem,Location,CostOfSales,CostOnHand
1/01/2012,Product1,Location1,10,100
1/01/2012,Product1,Location2,12,100
1/01/2012,Product1,Location3,8,120
1/01/2012,Product2,Location1,30,335
1/01/2012,Product2,Location2,61,296
1/01/2012,Product2,Location3,70,301
1/01/2012,Product3,Location1,82,717
1/01/2012,Product3,Location2,22,828
1/01/2012,Product3,Location3,36,513
1/02/2012,Product1,Location1,87,509
1/02/2012,Product1,Location2,26,881
1/02/2012,Product1,Location3,39,895
1/02/2012,Product2,Location1,88,44
1/02/2012,Product2,Location2,12,691
1/02/2012,Product2,Location3,75,991
1/02/2012,Product3,Location1,84,420
1/02/2012,Product3,Location2,97,709
1/02/2012,Product3,Location3,46,465
1/03/2012,Product1,Location1,80,556
1/03/2012,Product1,Location2,68,794
1/03/2012,Product1,Location3,72,536
1/03/2012,Product2,Location1,43,553
1/03/2012,Product2,Location2,4,874
1/03/2012,Product2,Location3,38,93
1/03/2012,Product3,Location1,86,558
1/03/2012,Product3,Location2,80,441
1/03/2012,Product3,Location3,63,990];
When calculating the Stock Turns for a StockItem, the values should be totalled across all Locations, the ratio calculated, then added together for each month.
Given the data above, I can calculate the correct results using a hard-coded Set Analysis expression as follows:
Sum({$<MonthStart={'1/01/2012'}>} CostOfSales) / Sum({$<MonthStart={'1/01/2012'}>} CostOnHand)
+
Sum({$<MonthStart={'1/02/2012'}>} CostOfSales) / Sum({$<MonthStart={'1/02/2012'}>} CostOnHand)
+
Sum({$<MonthStart={'1/03/2012'}>} CostOfSales) / Sum({$<MonthStart={'1/03/2012'}>} CostOnHand)
Obviously this will not work for production, but I cannot develop the correct Aggr expression to make it work dynamically.
Any help is very welcome. I will attach my sample app.
Accepted Solutions
- Mark as New
- Bookmark
- Subscribe
- Mute
- Subscribe to RSS Feed
- Permalink
- Report Inappropriate Content
Hi,
Check the attachment for solution, hope it helps you.
The expression used is
=Sum(Aggr(Sum(CostOfSales)/Sum(CostOnHand), MonthStart, StockItem))
Regards,
Jagan.
- Mark as New
- Bookmark
- Subscribe
- Mute
- Subscribe to RSS Feed
- Permalink
- Report Inappropriate Content
Hi,
Check the attachment for solution, hope it helps you.
The expression used is
=Sum(Aggr(Sum(CostOfSales)/Sum(CostOnHand), MonthStart, StockItem))
Regards,
Jagan.
- Mark as New
- Bookmark
- Subscribe
- Mute
- Subscribe to RSS Feed
- Permalink
- Report Inappropriate Content
Thanks for your help Jagan.
That does work for the table I showed in my original post.
It does not work, however, if you add the Location as a dimension. I was trying to implement Location as a conditional dimension and allow the client to turn it on and off with a button. Instead of this, I have created two seperate tables with different expressions and put them in a Container. Also added a third table to the container to show them the breakdown by Month.
Overall, I have given the client more information than they requested, but hopefully they can use it to validate the calculations and use it with confidence.
Regards,
Michael