Unlock a world of possibilities! Login now and discover the exclusive benefits awaiting you.
- Qlik Community
- :
- All Forums
- :
- QlikView App Dev
- :
- Aggregate data
- Subscribe to RSS Feed
- Mark Topic as New
- Mark Topic as Read
- Float this Topic for Current User
- Bookmark
- Subscribe
- Mute
- Printer Friendly Page
- Mark as New
- Bookmark
- Subscribe
- Mute
- Subscribe to RSS Feed
- Permalink
- Report Inappropriate Content
Aggregate data
Hi,
Please help me with the below requirement. I have data as below
Trade Payout Date Commission
A A1 07/06/2016 $50
A A2 07/06/2016 $75
A A3 07/06/2016 $35
B B1 08/06/2016 $50
B B2 08/06/2016 $25
B B3 09/06/2016 $75
C C1 09/06/2016 $50
C C2 09/06/2016 $50
C C3 10/06/2016 $15
The requirement is to show the data as follows, that means for each trade for a given date, show the sum of commissions for its payout that are less than or greater than $100. See how in the given example, the 4th row is not shown or suppressed.
A A1, A2, A3 07/06/2016 $160
B B1, B2 08/06/2016 $ 75
B B3 09/06/2016 $ 75
C C1,C2 09/06/2016 $100 (suppress or not show this row)
C C3 10/06/2016 $ 15
Thank you.
Deepti
Accepted Solutions
- Mark as New
- Bookmark
- Subscribe
- Mute
- Subscribe to RSS Feed
- Permalink
- Report Inappropriate Content
Hi Deepti,
Please do the following steps.
load * inline
[
Trade , Payout, Date , Commission
A , A1 , 07/06/2016 , 50
A , A2 , 07/06/2016 , 75
A , A3 , 07/06/2016 , 35
B , B1 , 08/06/2016 , 50
B , B2 , 08/06/2016 , 25
B , B3 , 09/06/2016 , 75
C , C1 , 09/06/2016 , 50
C , C2 , 09/06/2016 , 50
C , C3 , 10/06/2016 , 15
];
Create a pivot Table
Choose Trade and Date as dimensions.
Expression1: Concat(Payout, ',')
Expression2: Sum(Commission)
Good luck.
Ram
- Mark as New
- Bookmark
- Subscribe
- Mute
- Subscribe to RSS Feed
- Permalink
- Report Inappropriate Content
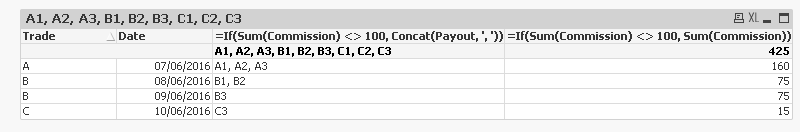
To supress 100, modify expression2 as follows.
if(Sum(Commission)<> 100, Sum(Commission), 'NA')
- Mark as New
- Bookmark
- Subscribe
- Mute
- Subscribe to RSS Feed
- Permalink
- Report Inappropriate Content
This?
- Mark as New
- Bookmark
- Subscribe
- Mute
- Subscribe to RSS Feed
- Permalink
- Report Inappropriate Content
It worked. Thanks Ramkumar.
Thanks.
Deepti
- Mark as New
- Bookmark
- Subscribe
- Mute
- Subscribe to RSS Feed
- Permalink
- Report Inappropriate Content
It worked with this method as well. Thanks Sunny.
Thanks.
Deepti