Unlock a world of possibilities! Login now and discover the exclusive benefits awaiting you.
- Qlik Community
- :
- All Forums
- :
- QlikView App Dev
- :
- Aggregation Help in Chart
Options
- Subscribe to RSS Feed
- Mark Topic as New
- Mark Topic as Read
- Float this Topic for Current User
- Bookmark
- Subscribe
- Mute
- Printer Friendly Page
Turn on suggestions
Auto-suggest helps you quickly narrow down your search results by suggesting possible matches as you type.
Showing results for
Contributor III
2016-04-03
05:03 AM
- Mark as New
- Bookmark
- Subscribe
- Mute
- Subscribe to RSS Feed
- Permalink
- Report Inappropriate Content
Aggregation Help in Chart
Hi All
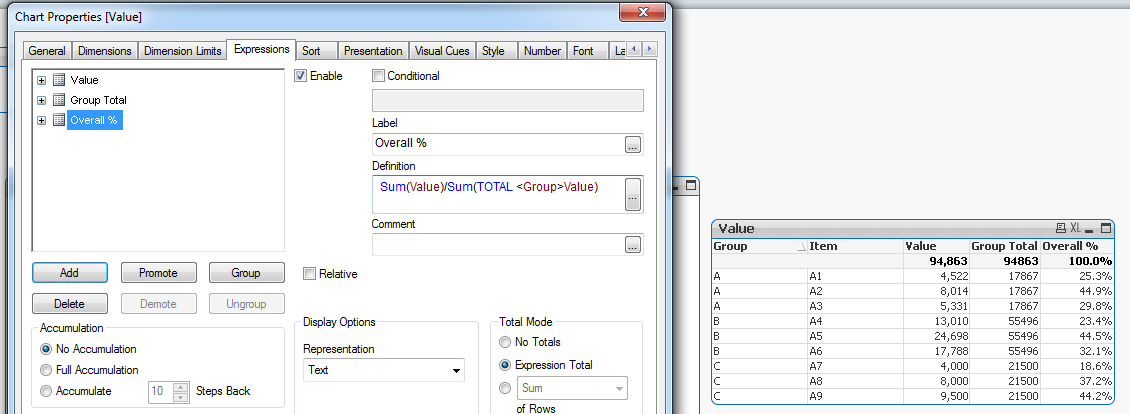
I need help in a chart where I have to show the value and percentage of value on group total. I have attached the sample file. Presently percentage is showing only on 3 rows.
749 Views
1 Solution
Accepted Solutions
Partner - Creator II
2016-04-03
06:01 AM
- Mark as New
- Bookmark
- Subscribe
- Mute
- Subscribe to RSS Feed
- Permalink
- Report Inappropriate Content
646 Views
4 Replies
Partner - Creator II
2016-04-03
06:01 AM
- Mark as New
- Bookmark
- Subscribe
- Mute
- Subscribe to RSS Feed
- Permalink
- Report Inappropriate Content
Hi,
Kindly check my solution.
Hope that helps.
Regards,
Mithilesh
647 Views
Contributor III
2016-04-03
06:25 AM
Author
- Mark as New
- Bookmark
- Subscribe
- Mute
- Subscribe to RSS Feed
- Permalink
- Report Inappropriate Content
Hi
But all the items not showing in the charts.
Regards
PKP
646 Views
MVP
2016-04-03
06:40 AM
- Mark as New
- Bookmark
- Subscribe
- Mute
- Subscribe to RSS Feed
- Permalink
- Report Inappropriate Content
I would steer you away from Aggr() function as they take a toll on performance. You can try this expression:
Sum(Value)/Sum(TOTAL <Group>Value)
646 Views
MVP
2016-04-03
06:43 AM
- Mark as New
- Bookmark
- Subscribe
- Mute
- Subscribe to RSS Feed
- Permalink
- Report Inappropriate Content
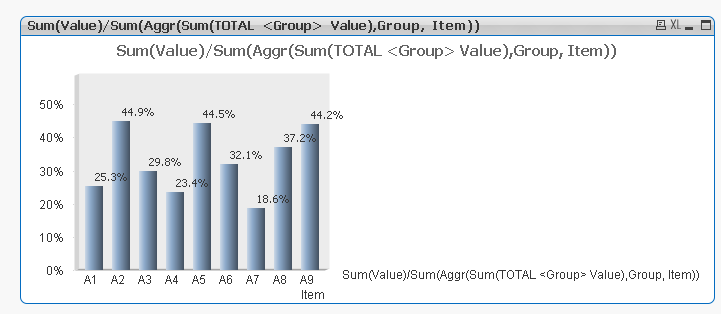
For the chart, you can try this:
Sum(Value)/Sum(Aggr(Sum(TOTAL <Group> Value),Group, Item))
646 Views