Unlock a world of possibilities! Login now and discover the exclusive benefits awaiting you.
- Qlik Community
- :
- All Forums
- :
- QlikView App Dev
- :
- Re: Aggregation function Problem
- Subscribe to RSS Feed
- Mark Topic as New
- Mark Topic as Read
- Float this Topic for Current User
- Bookmark
- Subscribe
- Mute
- Printer Friendly Page
- Mark as New
- Bookmark
- Subscribe
- Mute
- Subscribe to RSS Feed
- Permalink
- Report Inappropriate Content
Aggregation function Problem
Hello Qview Community!
I'm relatively new to qlikvew and I did a couple of tutorials, but now I've reached a problem that I can't solve.
I have a big DB and there is an expression I can't seem to do properly. This is a simplified part of it:
| P&L | YrMth | Value |
|---|---|---|
Logistics | 201401 | 1000 |
| Commission | 201401 | 500 |
| Labor | 201401 | 300 |
| Sales | 201401 | 8000 |
| Other | 201401 | 3000 |
| Logistics | 201402 | 1200 |
| Comission | 201402 | 400 |
| Labor | 201402 | 400 |
| Sales | 201402 | 9000 |
| Other | 201402 | 1100 |
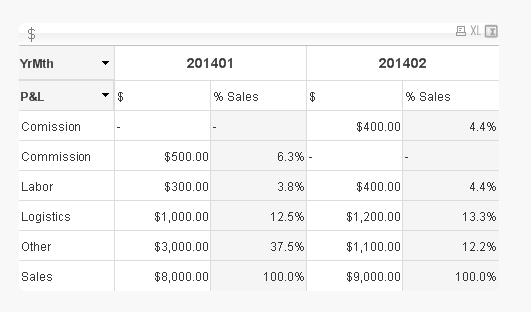
What I want to do is a Pivot table where the dimensions are [P&L] and [Yr/Mth]. In the expressions I'd like to see sum(Value) and it's ratio to the sales relative to that month.
I've tried the following expression: sum(Value) / sum({$<[P&L] = {'Sales'}>} Value). But I only get information in the "Sales" line.
I see that this may be obvious to some, but I still don't have the Qlikview "mentality" going on.
I also tried aggr(sum( {$< [P&L]={'Sales'} >} Value), [P&L], [Yr/Mth]). I tried using TOTAL but it gives me the total for all the months and I'd like it to calculate for each month, without having to select that specific month
Could you please help me?
Thank you very much!
Accepted Solutions
- Mark as New
- Bookmark
- Subscribe
- Mute
- Subscribe to RSS Feed
- Permalink
- Report Inappropriate Content
Here is a solution for the % of total by YrMnth
sum( Value)
/
sum( total <YrMth> {$<[P&L]={'Sales'}>} Value)
- Mark as New
- Bookmark
- Subscribe
- Mute
- Subscribe to RSS Feed
- Permalink
- Report Inappropriate Content
Here is a solution for the % of total by YrMnth
sum( Value)
/
sum( total <YrMth> {$<[P&L]={'Sales'}>} Value)
- Mark as New
- Bookmark
- Subscribe
- Mute
- Subscribe to RSS Feed
- Permalink
- Report Inappropriate Content
Thank you so much for the fast response!
- Mark as New
- Bookmark
- Subscribe
- Mute
- Subscribe to RSS Feed
- Permalink
- Report Inappropriate Content
Hello, I have another question now!
I tried making a bar chart out of this information now and it doesnt respect my selections. 
The excluded selections in my dimensions still appear in my graph.
How can I solve this?
- Mark as New
- Bookmark
- Subscribe
- Mute
- Subscribe to RSS Feed
- Permalink
- Report Inappropriate Content
So a line chart gets tricky with 2 dimensions and 2 measures. (which is what we have above). 2 dimensions and 1 measure is ok and 1 dimension and 2 measures. You can do 2 dims and 2 measures in a stacked bar chart where both measures are on the same axis... but that is pretty specific.
Do you have a picture of the line chart you have in mind ? I'm thinking maybe have 2 charts...1 for each expression.