Unlock a world of possibilities! Login now and discover the exclusive benefits awaiting you.
- Qlik Community
- :
- All Forums
- :
- QlikView App Dev
- :
- Re: Aggregation problem using variable
- Subscribe to RSS Feed
- Mark Topic as New
- Mark Topic as Read
- Float this Topic for Current User
- Bookmark
- Subscribe
- Mute
- Printer Friendly Page
- Mark as New
- Bookmark
- Subscribe
- Mute
- Subscribe to RSS Feed
- Permalink
- Report Inappropriate Content
Aggregation problem using variable
Hey,
I'm using a variable vCurrentSales in several charts:
sum({<Year={$(vCurrentYear)} >} $(vSales))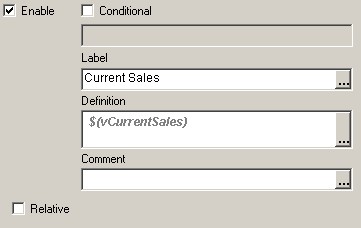
Now, for one specific chart I would like to add another set analysis condition.
sum({<Month = {1} >} $(vCurrentSales))
The result of this expression is just NULL ... Does anybody have an idea?
Thanks in advance!
- « Previous Replies
-
- 1
- 2
- Next Replies »
Accepted Solutions
- Mark as New
- Bookmark
- Subscribe
- Mute
- Subscribe to RSS Feed
- Permalink
- Report Inappropriate Content
- Mark as New
- Bookmark
- Subscribe
- Mute
- Subscribe to RSS Feed
- Permalink
- Report Inappropriate Content
Florain:
Can you try using:
$(Replace(vCurrentSales,'>}',',Month = {1}>}'))
Kiran.
- Mark as New
- Bookmark
- Subscribe
- Mute
- Subscribe to RSS Feed
- Permalink
- Report Inappropriate Content
Kiran,
thank you very much! I like your suggestion, but for some reason the formula still shows NULLs.
When I omit the Dollar-function $(...) I get the following string:
sum({<Year={$(vCurrentYear)}, Month = {1}>} $(vSales))
which seems okay actually.
There must be a litte thing that I miss ...
- Mark as New
- Bookmark
- Subscribe
- Mute
- Subscribe to RSS Feed
- Permalink
- Report Inappropriate Content
Florian
What is in vSales? Have you tested that
Sum($(vSales))
works.This is just to test that vSales is not the problem
Regards
Jonathan
- Mark as New
- Bookmark
- Subscribe
- Mute
- Subscribe to RSS Feed
- Permalink
- Report Inappropriate Content
Hi Jonathan,
I've just tested it and you're right: Sum($(vSales)) doesn't work either.
Variable vSales contains:
sum({< FlagInnovation = {1} >} Sales)I can't see the problem ...
Regard,
Florian
- Mark as New
- Bookmark
- Subscribe
- Mute
- Subscribe to RSS Feed
- Permalink
- Report Inappropriate Content
Hi Florain,
Can you post a sample of your application with just relavant data and variables created?
Kiran.
- Mark as New
- Bookmark
- Subscribe
- Mute
- Subscribe to RSS Feed
- Permalink
- Report Inappropriate Content
Florian
You cant nest aggregation functions. Sum(Sum(....)) is not allowed. First see if you can do this another way, but if you must nest them, you will need to use Aggr().
Sum(Aggr(Sum({< FlagInnovation = {1} >} Sales), some dimension(s)))
The dimensions must be a comma separated list of one or more field names for which the inner sum is being evaluated, and must include the chart dimensions if inside a chart.
Regards
Jonathan
- Mark as New
- Bookmark
- Subscribe
- Mute
- Subscribe to RSS Feed
- Permalink
- Report Inappropriate Content
Hi Kiran/Jonathan,
thank you very much for your help!
Nested aggregation seems to be the problem. I've attached a sample file now.
To simplify matters I modified my example a little bit (other variables) - but I think, it still illustrates my problem.
Regards,
Florian
- Mark as New
- Bookmark
- Subscribe
- Mute
- Subscribe to RSS Feed
- Permalink
- Report Inappropriate Content
Florian
The set analysis does not apply into the aggregation function, so you need to re-apply the expression inside the aggregation. In your example, I think you get the correct results if you change vSalesInnovation to:
sum({<FlagInnovation = {1}, Year = {'2012'}>} Sales)
in fact, you can remove the Year condition in the chart expression as it is redundant, so:
sum(aggr($(vSalesInnovation),Country))
Hope that helps
Jonathan
- Mark as New
- Bookmark
- Subscribe
- Mute
- Subscribe to RSS Feed
- Permalink
- Report Inappropriate Content
Possibly better, add Year to the Aggr dimensions:
sum({<Year = {"2012"}>}aggr($(vSalesInnovation),Country, Year))
and leave vSalesInnovation unchanged. That also works.
Regards
Jonathan
- « Previous Replies
-
- 1
- 2
- Next Replies »