Unlock a world of possibilities! Login now and discover the exclusive benefits awaiting you.
- Qlik Community
- :
- All Forums
- :
- QlikView App Dev
- :
- Re: Aggregation problem
- Subscribe to RSS Feed
- Mark Topic as New
- Mark Topic as Read
- Float this Topic for Current User
- Bookmark
- Subscribe
- Mute
- Printer Friendly Page
- Mark as New
- Bookmark
- Subscribe
- Mute
- Subscribe to RSS Feed
- Permalink
- Report Inappropriate Content
Aggregation problem
Hi all,
I have to aggregate an expression but when i do i am not getting all of the values assigned to the correct rows.
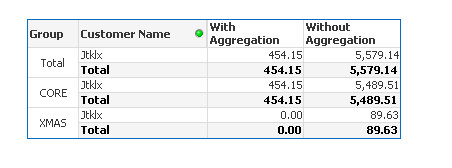
In the above, when i don't aggregate i have values against the XMAS row. This is lost when i aggregate and can't seem to find a way to get the values to display.
In the image below, the last column shows the correct values (this is just for a single period), i need the expression to take into account the full year, i have set analysis in the top table to account for that but it doesnt seem to work either.
So if you select all of the period (1-13), the last expression shows 409k, this is what i need in the top table and split by CORE and XMAS.
the other problem is that the top table is a pivot table, i need to total by sum of rows which is not an option in a pivot table.
Can anyone help please?
sample attached.
- Mark as New
- Bookmark
- Subscribe
- Mute
- Subscribe to RSS Feed
- Permalink
- Report Inappropriate Content
I am confused because to get to 409k... you would need to use the same formula you are using in the below table... but if you do that... then the result won't match when one period is selected. What exactly are the numbers you are looking to get with and without period selection?
- Mark as New
- Bookmark
- Subscribe
- Mute
- Subscribe to RSS Feed
- Permalink
- Report Inappropriate Content
Hi Sunny,
So, a selection on Period is a must 'always one selected value' will be ticked against the field.
so what i want is the expression to take into account all periods <= selected period (which i have now updated the expression in the attached QVW).
As you can see, i have copied the expression to the top pivot table and i do get the value needed but its against CORE and nothing against XMAS.
If you then select Periods 5-8 you will see that there are actually sales against XMAS in the bottom table when looking at the earlier expressions (which are a breakdown of the full one).
Does that make sense?