Unlock a world of possibilities! Login now and discover the exclusive benefits awaiting you.
- Qlik Community
- :
- All Forums
- :
- QlikView App Dev
- :
- Re: Aging on the selected day
- Subscribe to RSS Feed
- Mark Topic as New
- Mark Topic as Read
- Float this Topic for Current User
- Bookmark
- Subscribe
- Mute
- Printer Friendly Page
- Mark as New
- Bookmark
- Subscribe
- Mute
- Subscribe to RSS Feed
- Permalink
- Report Inappropriate Content
Aging on the selected day
Hi all,
I have stuck and need some help how to handled this topic? The aim of the task is start showing distribution age of item on the stock.
Master data table contains 12+ mln records with all movement recorded.
example:
Script:
So far is ok
I can use DaysinStock to calculate agebucket
output is ok but works only for snapshot for actual day (I mean today())
how can I achieve dynamic graph so when I select "2020-11-05" then the item from the example should be automatically placed in age bucket '<10 days' (age = '2020-11-06' - '2020-10-30' it should be 6 days) but with my current code is still in '61 - 90' (age = '2021-01-08' - '2020-10-30' so 70 days.
the expression which I use works fine only for actual day. When I change [Check stock date] it is not working fully ok
count(distinct{< FirstTimeIN={"<=$(=only([Check stock date]))"} >} %KEY_ACTUAL)
- Mark as New
- Bookmark
- Subscribe
- Mute
- Subscribe to RSS Feed
- Permalink
- Report Inappropriate Content
HI @waszcma1
If you want dynamic o/p, you need to calculate the Daysinstock / aging in front end instead of script.
Instead of Today, you can use max( [Check stock date]) in front end.
use variable, for easy approach.
Please close the thread by marking correct answer & give likes if you like the post.
- Mark as New
- Bookmark
- Subscribe
- Mute
- Subscribe to RSS Feed
- Permalink
- Report Inappropriate Content
Hi,
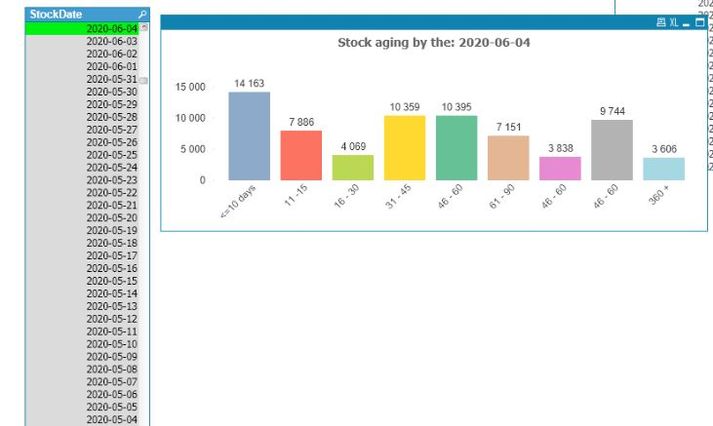
I have managed to do that what I wanted but performance is far far from good (one click on stock date causing 110 sec recalculating on bar chart)
StockDate is from island Table generated from min/max of dates stored in stock table .
Agebucket dimension is also taken from island so I could use pick() function to address the right count into the right bucket frame.
I know the expression is nasty but only this came to my mind and it works for all possible dates. Now the only way to increase speed is to prepare on backend some table with pre calculated age for some possible dates. But it is only workaround as I cant image do this for all 365 days and it is only one year.
Can you advice any other approach?


