Unlock a world of possibilities! Login now and discover the exclusive benefits awaiting you.
- Qlik Community
- :
- All Forums
- :
- QlikView App Dev
- :
- Re: Allocated memory exceed in chart
- Subscribe to RSS Feed
- Mark Topic as New
- Mark Topic as Read
- Float this Topic for Current User
- Bookmark
- Subscribe
- Mute
- Printer Friendly Page
- Mark as New
- Bookmark
- Subscribe
- Mute
- Subscribe to RSS Feed
- Permalink
- Report Inappropriate Content
Allocated memory exceed in chart
Hi everyone!
I am begginer in QV and have some, maybe, simple question. I tryed to build chart with calculate dimention (change the x-axis depending on selection in list box - Date, Week, Month and Year), but when I put expression like sum(Payments) i get "Allocated memory exceed" (when I put sum(1) it works well).
Could you suggest me something to avoid it?
thanks in advance
- « Previous Replies
-
- 1
- 2
- Next Replies »
- Mark as New
- Bookmark
- Subscribe
- Mute
- Subscribe to RSS Feed
- Permalink
- Report Inappropriate Content
Can you please upload sample here.
Thanks,
AS
- Mark as New
- Bookmark
- Subscribe
- Mute
- Subscribe to RSS Feed
- Permalink
- Report Inappropriate Content
Hi Inna,
I think you calculate dimension is not correct.
Please check your calculated dimension.
Hope this will work for you.
-- Regards,
Vishal Waghole
- Mark as New
- Bookmark
- Subscribe
- Mute
- Subscribe to RSS Feed
- Permalink
- Report Inappropriate Content
I can't upload a sample, because have not access to Internet from working server with QV.
I used two variables for calculate dimension:
1. Period_chart2=if( GetFieldSelections(Period)='Date',1, if(GetFieldSelections(Period)='Week',2,if(GetFieldSelections(Period)='Month',3,4))) // the number of selection
2.Period_chart=pick($(Period_chart2), [Date], [Year_Week] ,[Year_Month], [Year]) //select dimension according to number
and in calculate dimension I write =$(Period_chart)
Thanks
- Mark as New
- Bookmark
- Subscribe
- Mute
- Subscribe to RSS Feed
- Permalink
- Report Inappropriate Content
Try with this:
2.Period_chart=pick($(Period_chart2), Date, Year_Week,Year_Month, Year)
Thanks,
AS
- Mark as New
- Bookmark
- Subscribe
- Mute
- Subscribe to RSS Feed
- Permalink
- Report Inappropriate Content
Instead of doing all such Calculation using Variables and Calculated Dimension you can use:
Cyclic or Drill-Down Approach.
Regards
Aviral Nag
- Mark as New
- Bookmark
- Subscribe
- Mute
- Subscribe to RSS Feed
- Permalink
- Report Inappropriate Content
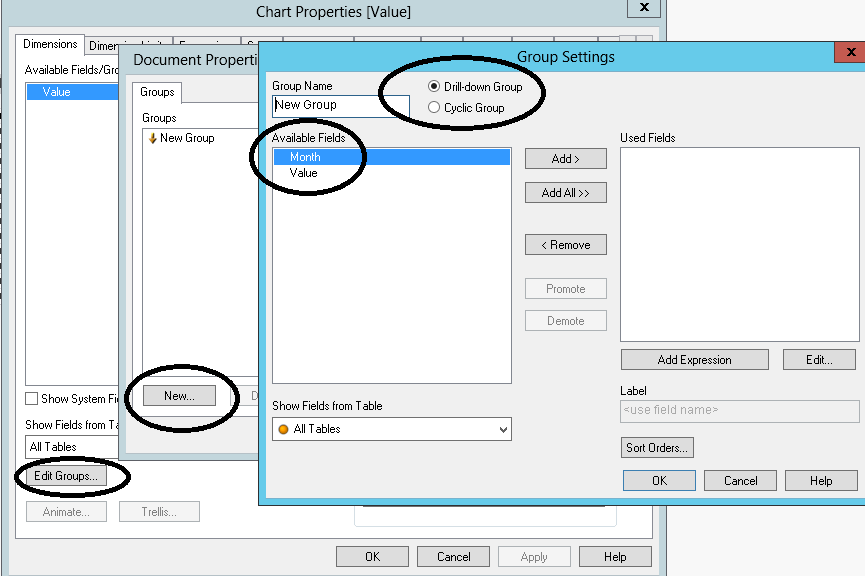
Create Cyclic or Drill-Down Groups:
- Mark as New
- Bookmark
- Subscribe
- Mute
- Subscribe to RSS Feed
- Permalink
- Report Inappropriate Content
Isn't work (message "Allocated..." remain). But for chart expression like =sum(1) it works perfectly. maybe, thare are problems with row data(
- Mark as New
- Bookmark
- Subscribe
- Mute
- Subscribe to RSS Feed
- Permalink
- Report Inappropriate Content
Thanks, but I have different variables for different dimensions (For Date is one variable, for Week another) - that's why I did not use it. And there are plenty of charts on worksheet. It Would be much easier to have a selection table.
- Mark as New
- Bookmark
- Subscribe
- Mute
- Subscribe to RSS Feed
- Permalink
- Report Inappropriate Content
hi
create some thing like below
create a inline table
Load * Inline [
KPI
1
2
3
4
5
];
then use the below expression as your values
PICK(Match(KPI, 1,2,3,4),'Date','Week','Month','year')
- « Previous Replies
-
- 1
- 2
- Next Replies »