Unlock a world of possibilities! Login now and discover the exclusive benefits awaiting you.
- Qlik Community
- :
- All Forums
- :
- QlikView App Dev
- :
- Allow user to change aggregations in a straight ta...
- Subscribe to RSS Feed
- Mark Topic as New
- Mark Topic as Read
- Float this Topic for Current User
- Bookmark
- Subscribe
- Mute
- Printer Friendly Page
- Mark as New
- Bookmark
- Subscribe
- Mute
- Subscribe to RSS Feed
- Permalink
- Report Inappropriate Content
Allow user to change aggregations in a straight table
I have a straight table that a user can select which dimensions and metrics will be shown in the straight table. The totals are by the expression. The user would like to switch between a sum and an avg depending on which metrics they choose. Is there an easy way to let them do this since they will not be able to access chart properties? Perhaps a quick toggle?
- « Previous Replies
-
- 1
- 2
- Next Replies »
- Mark as New
- Bookmark
- Subscribe
- Mute
- Subscribe to RSS Feed
- Permalink
- Report Inappropriate Content
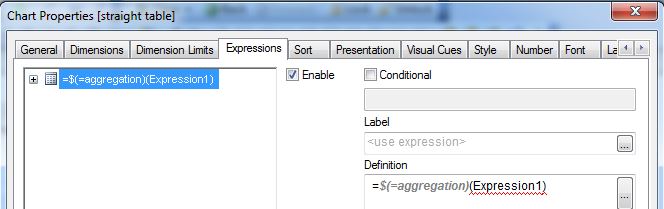
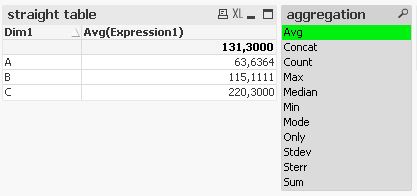
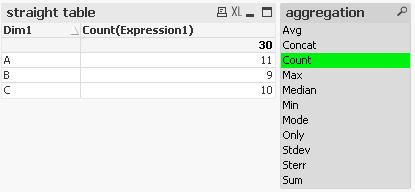
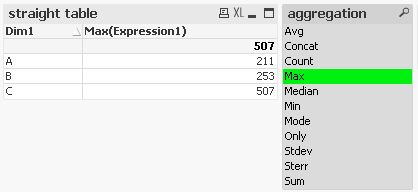
just to prove that in most cases there is more than one solution in QlikView:
Transactions:
Load
TransLineID,
TransID,
Pick(Ceil(3*Rand1),'A','B','C') as Dim1,
Round(1000*Rand()*Rand()*Rand1) as Expression1;
Load
Rand() as Rand1,
IterNo() as TransLineID,
RecNo() as TransID
Autogenerate 30;

tabAggregations:
LOAD * INLINE [
    aggregation
    Sum
    Count
    Avg
    Min
    Max
    Only
    Mode
    Concat
    Stdev
    Sterr
    Median
];
hope this helps
regards
Marco
- Mark as New
- Bookmark
- Subscribe
- Mute
- Subscribe to RSS Feed
- Permalink
- Report Inappropriate Content
For independent expressions (e.g. with different parameters) you could also use an island table with selection name and expression fields or a Pick(Match(...)...) combination.
hope this helps
regards
Marco
- « Previous Replies
-
- 1
- 2
- Next Replies »