Unlock a world of possibilities! Login now and discover the exclusive benefits awaiting you.
Announcements
Save $650 on Qlik Connect, Dec 1 - 7, our lowest price of the year. Register with code CYBERWEEK: Register
- Qlik Community
- :
- All Forums
- :
- QlikView App Dev
- :
- Re: Alternate Axis
Options
- Subscribe to RSS Feed
- Mark Topic as New
- Mark Topic as Read
- Float this Topic for Current User
- Bookmark
- Subscribe
- Mute
- Printer Friendly Page
Turn on suggestions
Auto-suggest helps you quickly narrow down your search results by suggesting possible matches as you type.
Showing results for
Not applicable
2017-05-19
05:11 PM
- Mark as New
- Bookmark
- Subscribe
- Mute
- Subscribe to RSS Feed
- Permalink
- Report Inappropriate Content
Alternate Axis
Hi All,
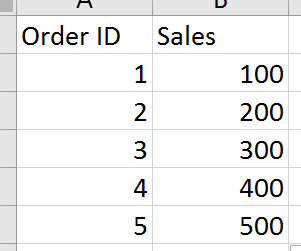
How do I show values in x or y-axis (like 1, 3, 5 etc.,) for Order ID. When I use Static Step as 2 it is showing up as (2, 4, 6 instead of 1, 3, 5). I want to see all the 5 rows populated but only scale for the axis as 1, 3 and 5
Below is my sample data.
Thanks
VJ
457 Views
1 Solution
Accepted Solutions
MVP
2017-05-19
05:51 PM
- Mark as New
- Bookmark
- Subscribe
- Mute
- Subscribe to RSS Feed
- Permalink
- Report Inappropriate Content
Maybe like this using a calculated dimension:
![2017-05-19 23_51_26-QlikView x64 - [C__Users_Stefan_Downloads_Qlitest.qvw_].png](/legacyfs/online/164110_2017-05-19 23_51_26-QlikView x64 - [C__Users_Stefan_Downloads_Qlitest.qvw_].png)
=If(Odd([Order ID]), [Order ID], Dual(' ',[Order ID]))
380 Views
1 Reply
MVP
2017-05-19
05:51 PM
- Mark as New
- Bookmark
- Subscribe
- Mute
- Subscribe to RSS Feed
- Permalink
- Report Inappropriate Content
Maybe like this using a calculated dimension:
=If(Odd([Order ID]), [Order ID], Dual(' ',[Order ID]))
381 Views