Unlock a world of possibilities! Login now and discover the exclusive benefits awaiting you.
- Qlik Community
- :
- All Forums
- :
- QlikView App Dev
- :
- Alternate State - Problem with graphs
- Subscribe to RSS Feed
- Mark Topic as New
- Mark Topic as Read
- Float this Topic for Current User
- Bookmark
- Subscribe
- Mute
- Printer Friendly Page
- Mark as New
- Bookmark
- Subscribe
- Mute
- Subscribe to RSS Feed
- Permalink
- Report Inappropriate Content
Alternate State - Problem with graphs
Hello.
Im using "Alternate State" in 4 different chart.
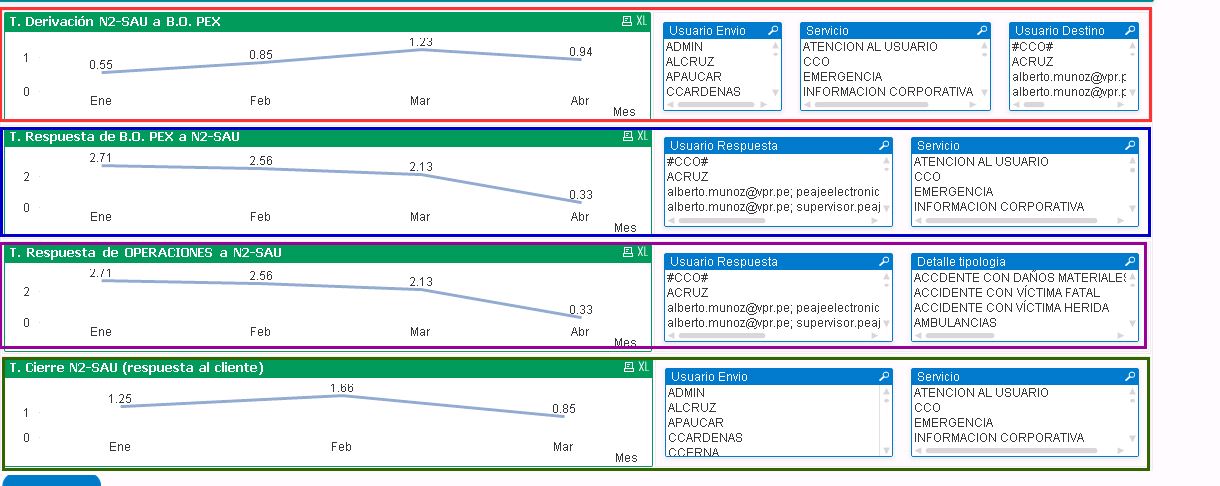
The first group (red color) is has the alternate state "estado1", the second one (blue color) has "estado2", the 3rd one has "estado3" and the last one (green color) has a "estado4".
When i select a dimension from 2nd group with alternate state "estado2", all graphs change, and i suppose that only the 2nd graph have to change, not all.
Please, need your help, I need that for each group, each dimension works only for the corresponding graph. Are there any other settings?
Accepted Solutions
- Mark as New
- Bookmark
- Subscribe
- Mute
- Subscribe to RSS Feed
- Permalink
- Report Inappropriate Content
Check now... your expressions were all using the second alternate state
- Mark as New
- Bookmark
- Subscribe
- Mute
- Subscribe to RSS Feed
- Permalink
- Report Inappropriate Content
Check now... your expressions were all using the second alternate state
- Mark as New
- Bookmark
- Subscribe
- Mute
- Subscribe to RSS Feed
- Permalink
- Report Inappropriate Content
Thanks. You rigth, I did not notice the expression 