Unlock a world of possibilities! Login now and discover the exclusive benefits awaiting you.
- Qlik Community
- :
- All Forums
- :
- QlikView App Dev
- :
- Analyzing the same data using two bar charts
- Subscribe to RSS Feed
- Mark Topic as New
- Mark Topic as Read
- Float this Topic for Current User
- Bookmark
- Subscribe
- Mute
- Printer Friendly Page
- Mark as New
- Bookmark
- Subscribe
- Mute
- Subscribe to RSS Feed
- Permalink
- Report Inappropriate Content
Analyzing the same data using two bar charts
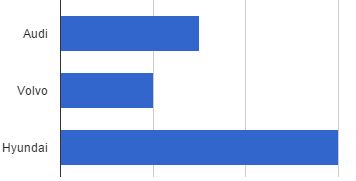
I have a Chart which displays the sale of a particular brand.
Like this (Fig 1)

Since, BMW can have competitors. I need to show that as another chart (instead of everything in a single bar chart)
Like this
So, this is how my dashboard works.
1. User clicks a brand in a List box provided.
2. Fig 1 shows the sales for that Brand.
3. Fig 2 shows the sales of it's competitors
Fig 1 requires a normal SUM(Sales) expression. However, Fig 2 requires values other than the one used in Fig 1.
I tried this using Set Analysis like SUM({<Brand={*}-{'BMW'}>}Sales)
This works only for BMW. I need to calculate the value dynamically based on the selection user makes. GetSelections functions are not working inside set. How this can be done?
Accepted Solutions
- Mark as New
- Bookmark
- Subscribe
- Mute
- Subscribe to RSS Feed
- Permalink
- Report Inappropriate Content
Hi,
Try like this
Chart 1: for BMW
=Sum(Sales)
Chart 2 for Competitors:
=Sum({<Brand={'*'}>} Sales) - Sum(Sales)
Hope this helps you.
Regards,
Jagan.
- Mark as New
- Bookmark
- Subscribe
- Mute
- Subscribe to RSS Feed
- Permalink
- Report Inappropriate Content
Hi,
You must chek "Always One Value Selected" in your ListBox for your selections. This ListBox should be your field "Brand" and then use set Analysis like this:
=sum({$<Brand <> {GetFieldSelections(Brand)} >} Sales)
Hope it helped 
- Mark as New
- Bookmark
- Subscribe
- Mute
- Subscribe to RSS Feed
- Permalink
- Report Inappropriate Content
HI,
Comparative analysis will help here
take one Flag competitor then split the Brand Filter in to 2 listboxes
use Set analysis with Alternate states if you want to see Company vs Competitors
- Mark as New
- Bookmark
- Subscribe
- Mute
- Subscribe to RSS Feed
- Permalink
- Report Inappropriate Content
Hi,
Try like this
Chart 1: for BMW
=Sum(Sales)
Chart 2 for Competitors:
=Sum({<Brand={'*'}>} Sales) - Sum(Sales)
Hope this helps you.
Regards,
Jagan.
- Mark as New
- Bookmark
- Subscribe
- Mute
- Subscribe to RSS Feed
- Permalink
- Report Inappropriate Content
Hi,
Please use the exclude function in the second chart to exclude the current selection.
SUM({<Brand=E({$}Brand)>}Sales).
Hope this will resolve the issue.
Thanks.
- Mark as New
- Bookmark
- Subscribe
- Mute
- Subscribe to RSS Feed
- Permalink
- Report Inappropriate Content
Please find attached file for solution.
Regards,
jagan.
- Mark as New
- Bookmark
- Subscribe
- Mute
- Subscribe to RSS Feed
- Permalink
- Report Inappropriate Content
Thanks Jagan for that quick and brilliant solution. Simply ingenious. Thanks. 
- Mark as New
- Bookmark
- Subscribe
- Mute
- Subscribe to RSS Feed
- Permalink
- Report Inappropriate Content
For the second chart, you can use the e() function, to show the excluded brands:
SUM({<Brand= e() >}Sales)
- Mark as New
- Bookmark
- Subscribe
- Mute
- Subscribe to RSS Feed
- Permalink
- Report Inappropriate Content
Another great solution. Thanks