Unlock a world of possibilities! Login now and discover the exclusive benefits awaiting you.
Announcements
Qlik Connect 2025: 3 days of full immersion in data, analytics, and AI. May 13-15 | Orlando, FL:
Learn More
- Qlik Community
- :
- All Forums
- :
- QlikView App Dev
- :
- Any way to show all lines in a line chart?
Options
- Subscribe to RSS Feed
- Mark Topic as New
- Mark Topic as Read
- Float this Topic for Current User
- Bookmark
- Subscribe
- Mute
- Printer Friendly Page
Turn on suggestions
Auto-suggest helps you quickly narrow down your search results by suggesting possible matches as you type.
Showing results for
Not applicable
2017-06-14
03:05 PM
- Mark as New
- Bookmark
- Subscribe
- Mute
- Subscribe to RSS Feed
- Permalink
- Report Inappropriate Content
Any way to show all lines in a line chart?
I have a line chart, rotated so the orientation is horizontal.
Instead of lines, I have it as dots.
However, when I have a lot of data (aka dots) on the chart, the bottom dots get cut off unless I drag and resize the chart to be larger.
Is there a way to show all the dots, regardless of how large the chart is?
In the attached picture you can see the bottom dot is cut off, and below it are many more that aren't showing. 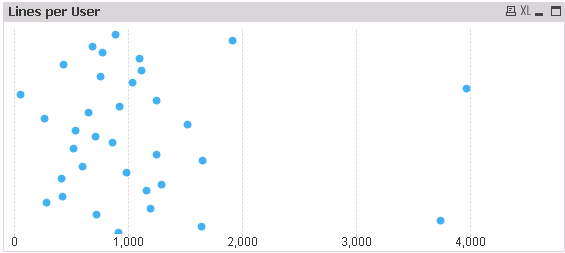
717 Views
2 Replies
Specialist
2017-06-14
03:46 PM
- Mark as New
- Bookmark
- Subscribe
- Mute
- Subscribe to RSS Feed
- Permalink
- Report Inappropriate Content
Maybe Forced Zero in the Graph Settings should help you
555 Views
Not applicable
2017-06-14
03:52 PM
Author
- Mark as New
- Bookmark
- Subscribe
- Mute
- Subscribe to RSS Feed
- Permalink
- Report Inappropriate Content
No, that doesnt show items that are off the graph
555 Views