Unlock a world of possibilities! Login now and discover the exclusive benefits awaiting you.
- Qlik Community
- :
- All Forums
- :
- QlikView App Dev
- :
- Appear a graph only when one value is choosen
- Subscribe to RSS Feed
- Mark Topic as New
- Mark Topic as Read
- Float this Topic for Current User
- Bookmark
- Subscribe
- Mute
- Printer Friendly Page
- Mark as New
- Bookmark
- Subscribe
- Mute
- Subscribe to RSS Feed
- Permalink
- Report Inappropriate Content
Appear a graph only when one value is choosen
Hello
Can some one explain me how to make that a graph will appear only when user choose a Serial number. and disappear if no SN was chooses
this graph is a stacked bars showing hours per day per FSE.
there is no meaning for this graph if we see all the machine
attached the data and qlikview
- Tags:
- new_to_qlikview
Accepted Solutions
- Mark as New
- Bookmark
- Subscribe
- Mute
- Subscribe to RSS Feed
- Permalink
- Report Inappropriate Content
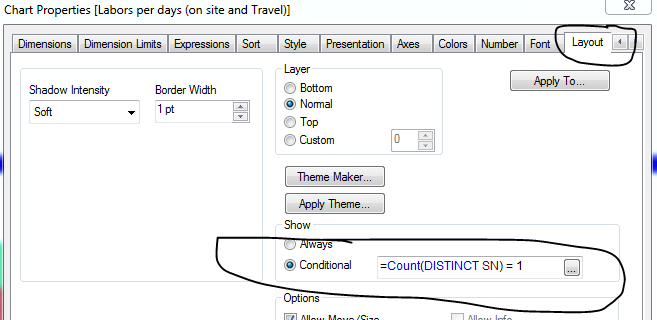
open the graph properties and then go to layout, in there on the middle right hand, click on conditional and then add =GetSelectedCount(SN) >0
this make the graph to only be displayed upon a selection being done for the SN field
- Mark as New
- Bookmark
- Subscribe
- Mute
- Subscribe to RSS Feed
- Permalink
- Report Inappropriate Content
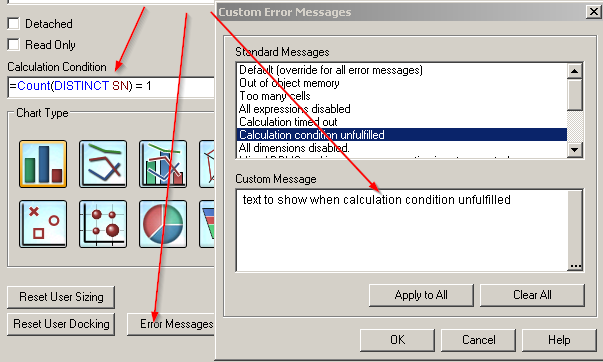
Use the following condition on the Layout tab of your chart (Labors Per days).
=Count(DISTINCT SN) = 1
Also attaching your application for reference.
HTH
Best,
Sunny !
- Mark as New
- Bookmark
- Subscribe
- Mute
- Subscribe to RSS Feed
- Permalink
- Report Inappropriate Content
open the graph properties and then go to layout, in there on the middle right hand, click on conditional and then add =GetSelectedCount(SN) >0
this make the graph to only be displayed upon a selection being done for the SN field
- Mark as New
- Bookmark
- Subscribe
- Mute
- Subscribe to RSS Feed
- Permalink
- Report Inappropriate Content
INCREDIBLE
THANKS a lot, One more thing I learned today
- Mark as New
- Bookmark
- Subscribe
- Mute
- Subscribe to RSS Feed
- Permalink
- Report Inappropriate Content
or here (General tab)