Unlock a world of possibilities! Login now and discover the exclusive benefits awaiting you.
- Qlik Community
- :
- All Forums
- :
- QlikView App Dev
- :
- Applying set analysis
- Subscribe to RSS Feed
- Mark Topic as New
- Mark Topic as Read
- Float this Topic for Current User
- Bookmark
- Subscribe
- Mute
- Printer Friendly Page
- Mark as New
- Bookmark
- Subscribe
- Mute
- Subscribe to RSS Feed
- Permalink
- Report Inappropriate Content
Applying set analysis
Hi,
I have attached my sample app here. In that we've 2 Charts
1. Transactions by Product
2. Transactions by Device
first one to be static since applied set analysis. But when I click any bar on first chart, second Char must be filtered accordingly. Fine every thing ok, But problem with %'s within second Chart.
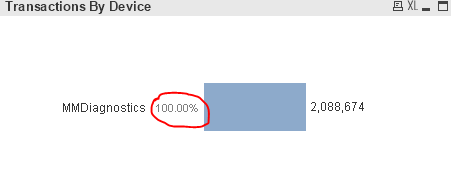
But I want this should not be change, should give actual ones.
I know set analysis must be applied, But I don't have much knowledge.
Pls. advice.
Br, Balanandam
Accepted Solutions
- Mark as New
- Bookmark
- Subscribe
- Mute
- Subscribe to RSS Feed
- Permalink
- Report Inappropriate Content
Like this?
Use this expression
Dual(Num(Sum(Unique_IMEI_Count), '#,##0.') & ' (' & Num(sum(Unique_IMEI_Count)/sum(TOTAL {<ProductName>} Unique_IMEI_Count) , '##.##%') & ')', Sum(Unique_IMEI_Count))
and make sure to select 'Expression Default' on the Numbers tab of chart properties
- Mark as New
- Bookmark
- Subscribe
- Mute
- Subscribe to RSS Feed
- Permalink
- Report Inappropriate Content
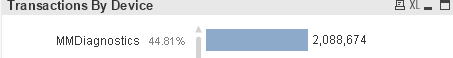
Use this expression and uncheck 'Relative'
sum(Unique_IMEI_Count)/sum(TOTAL {<ProductName>} Unique_IMEI_Count)
- Mark as New
- Bookmark
- Subscribe
- Mute
- Subscribe to RSS Feed
- Permalink
- Report Inappropriate Content
Thanks! sunny.
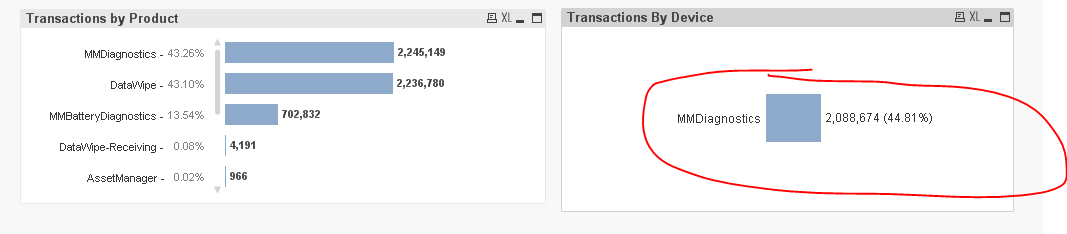
I've another concern here, that I need % besides of the count for both charts. !for ex:
2,088,674 (44.81%)
I tired concatenating two expressions, didn't get solved and my idea looked so silly. Can you advise here too!
Br, Balanandam
- Mark as New
- Bookmark
- Subscribe
- Mute
- Subscribe to RSS Feed
- Permalink
- Report Inappropriate Content
Like this?
Use this expression
Dual(Num(Sum(Unique_IMEI_Count), '#,##0.') & ' (' & Num(sum(Unique_IMEI_Count)/sum(TOTAL {<ProductName>} Unique_IMEI_Count) , '##.##%') & ')', Sum(Unique_IMEI_Count))
and make sure to select 'Expression Default' on the Numbers tab of chart properties
- Mark as New
- Bookmark
- Subscribe
- Mute
- Subscribe to RSS Feed
- Permalink
- Report Inappropriate Content
Thank you Sunny.
I've confused a lot with the expression but I'll dig myself into this and the DUAL() function.
Br, Balanandam