Unlock a world of possibilities! Login now and discover the exclusive benefits awaiting you.
- Qlik Community
- :
- All Forums
- :
- QlikView App Dev
- :
- Re: Assigning headers to multiple columns in pivot...
- Subscribe to RSS Feed
- Mark Topic as New
- Mark Topic as Read
- Float this Topic for Current User
- Bookmark
- Subscribe
- Mute
- Printer Friendly Page
- Mark as New
- Bookmark
- Subscribe
- Mute
- Subscribe to RSS Feed
- Permalink
- Report Inappropriate Content
Assigning headers to multiple columns in pivot table
Hello,
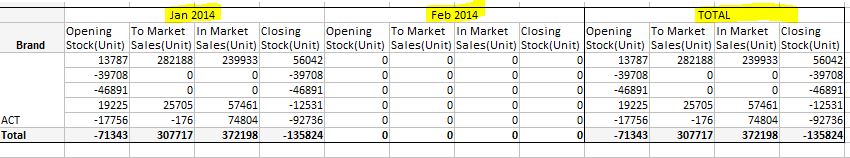
For the pivot chart, i have one dimension and 4 calculated expressions:

On selection of multiple months for example, Jan and Feb in year 2014, the pivot table gives me sum of both, is it possible to break the values monthwise in pivot/straight table as reflected in below diagram and then finding the TOTAL value for both the months.
Thanks
Accepted Solutions
- Mark as New
- Bookmark
- Subscribe
- Mute
- Subscribe to RSS Feed
- Permalink
- Report Inappropriate Content
I´m seeing a horizontal scrollbar, isn´t it at right side?
Please check at Presentation Tab if field Month_Name is market to Aggr
- Mark as New
- Bookmark
- Subscribe
- Mute
- Subscribe to RSS Feed
- Permalink
- Report Inappropriate Content
To do that you should have two dimensions, Brand and Month.
Then Pivot your table, dragging the column to upper size and then at Presentation tab mark "Subtotal" for any column you want
- Mark as New
- Bookmark
- Subscribe
- Mute
- Subscribe to RSS Feed
- Permalink
- Report Inappropriate Content
Thanks,
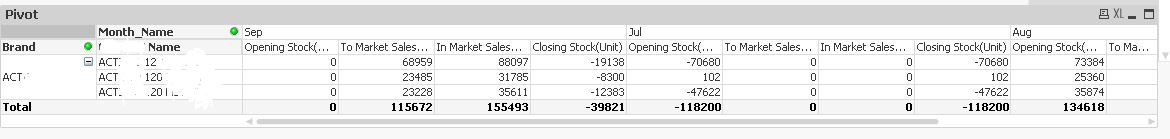
on selection of september 2013 and july 2013 , it gives me all possible months of 2013 having values present and it doesnt give me the total of september + july 2013
- Mark as New
- Bookmark
- Subscribe
- Mute
- Subscribe to RSS Feed
- Permalink
- Report Inappropriate Content
I´m seeing a horizontal scrollbar, isn´t it at right side?
Please check at Presentation Tab if field Month_Name is market to Aggr
- Mark as New
- Bookmark
- Subscribe
- Mute
- Subscribe to RSS Feed
- Permalink
- Report Inappropriate Content
thanks 
still not sure why august data is reflecting!
- Mark as New
- Bookmark
- Subscribe
- Mute
- Subscribe to RSS Feed
- Permalink
- Report Inappropriate Content
Could you check your expressions and fields Month_Name? Maybe there´s some relation between August month
Which field are you using to select? Same Month_Name?
- Mark as New
- Bookmark
- Subscribe
- Mute
- Subscribe to RSS Feed
- Permalink
- Report Inappropriate Content
expressions are fine. and on selection of month names september and october in year 2013. it shows me july + august+ september+ october data.
for 2013 year , there isnt data available from jan to june. so it provides me all months value prior to selected months