Unlock a world of possibilities! Login now and discover the exclusive benefits awaiting you.
- Qlik Community
- :
- All Forums
- :
- QlikView App Dev
- :
- Re: Associate the name of columns with a value
- Subscribe to RSS Feed
- Mark Topic as New
- Mark Topic as Read
- Float this Topic for Current User
- Bookmark
- Subscribe
- Mute
- Printer Friendly Page
- Mark as New
- Bookmark
- Subscribe
- Mute
- Subscribe to RSS Feed
- Permalink
- Report Inappropriate Content
Associate the name of columns with a value
Hi !
I have an excel file with this 2 sheets. I want to associate the skills with their sector. How can I do that ?
| User | Skill 1 | Skill 2 | Skill 3 | Skill 4 | Skill 5 | Skill 6 |
|---|---|---|---|---|---|---|
| user 1 | 0 | 2 | 4 | 2 | 3 | 0 |
| user 2 | 0 | 1 | 5 | 2 | 4 | 1 |
| user 3 | 1 | 3 | 2 | 1 | 0 | 2 |
| Sector | Skill |
|---|---|
| Sector 1 | skill 1 |
| Sector 1 | skill 2 |
| Sector 1 | skill 3 |
| Sector 2 | skill 4 |
| Sector 2 | skill 5 |
| Sector 2 | skill 6 |
Thank you 😃
Annie
- Tags:
- new_to_qlikview
- « Previous Replies
-
- 1
- 2
- Next Replies »
Accepted Solutions
- Mark as New
- Bookmark
- Subscribe
- Mute
- Subscribe to RSS Feed
- Permalink
- Report Inappropriate Content
hi Annie,
see attached qvw. I've added your radar charts to the initial load.
- Mark as New
- Bookmark
- Subscribe
- Mute
- Subscribe to RSS Feed
- Permalink
- Report Inappropriate Content
hi,
try loading like this:
loadData:
CROSSTABLE(Skill, value)
LOAD User,
[Skill 1],
[Skill 2],
[Skill 3],
[Skill 4],
[Skill 5],
[Skill 6]
FROM SectorSkills.xls (biff, embedded labels, table is Feuil1$);
SectorSkill:
LOAD Sector,
Skill
FROM SectorSkills.xls (biff, embedded labels, table is Feuil2$);
the crosstable load turns your first set of data into a more manageable form, that is the result is one field called Skill which can then be associtaed with your second dataset.
hope this helps.
- Mark as New
- Bookmark
- Subscribe
- Mute
- Subscribe to RSS Feed
- Permalink
- Report Inappropriate Content
hi pat.agen,
I tried your solution and the problem is that User is in the value table and it should not be a value. The aim of this file is to make 2 radas for the 2 sectors with every marks of every skill for each user... I don't know if I'm very clear 
- Mark as New
- Bookmark
- Subscribe
- Mute
- Subscribe to RSS Feed
- Permalink
- Report Inappropriate Content
annie.lovelace wrote:
hi pat.agen,
I tried your solution and the problem is that User is in the value table and it should not be a value. The aim of this file is to make 2 radas for the 2 sectors with every marks of every skill for each user... I don't know if I'm very clear
not able to understand your problem. Could explains us more in detail?
- Mark as New
- Bookmark
- Subscribe
- Mute
- Subscribe to RSS Feed
- Permalink
- Report Inappropriate Content
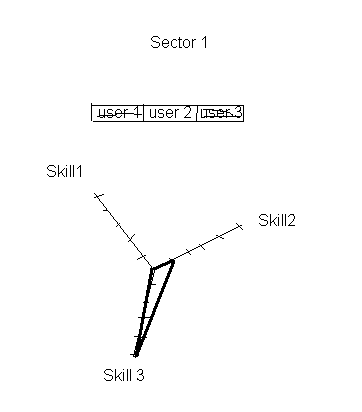
Maybe it's easier with a draw  Here is one of the chart that I need
- Mark as New
- Bookmark
- Subscribe
- Mute
- Subscribe to RSS Feed
- Permalink
- Report Inappropriate Content
Pat's suggestion of Crosstable looks about right to me. See the attached for how you might create a pivot table mapping users to sectors and skills. If that is not what you want, try to give us a picture of what you want the output to be.
-Rob
- Mark as New
- Bookmark
- Subscribe
- Mute
- Subscribe to RSS Feed
- Permalink
- Report Inappropriate Content
hi Annie,
see attached qvw. I've added your radar charts to the initial load.
- Mark as New
- Bookmark
- Subscribe
- Mute
- Subscribe to RSS Feed
- Permalink
- Report Inappropriate Content
Thank you ! I had a mistake in my excel file, that's why it didn't worked first... sorry  and thanks
- Mark as New
- Bookmark
- Subscribe
- Mute
- Subscribe to RSS Feed
- Permalink
- Report Inappropriate Content
Hi ,
I have a new problem with this table. In my first table, I have one more column with the role. And if I use the same solution you gave me, It doesn't work :
loadData:
CROSSTABLE(Skill, value)
LOAD Role,
User,
[Skill 1],
[Skill 2],
[Skill 3],
[Skill 4],
[Skill 5],
[Skill 6]
FROM SectorSkills.xls (biff, embedded labels, table is Feuil1$);
SectorSkill:
LOAD Sector,
Skill
FROM SectorSkills.xls (biff, embedded labels, table is Feuil2$);
How can I add the role and linked it to the user and the value ??
- Mark as New
- Bookmark
- Subscribe
- Mute
- Subscribe to RSS Feed
- Permalink
- Report Inappropriate Content
hi,
without seeing your changed input data it is hard to reply. Can you post this.
- « Previous Replies
-
- 1
- 2
- Next Replies »