Unlock a world of possibilities! Login now and discover the exclusive benefits awaiting you.
- Qlik Community
- :
- All Forums
- :
- QlikView App Dev
- :
- Average Column
- Subscribe to RSS Feed
- Mark Topic as New
- Mark Topic as Read
- Float this Topic for Current User
- Bookmark
- Subscribe
- Mute
- Printer Friendly Page
- Mark as New
- Bookmark
- Subscribe
- Mute
- Subscribe to RSS Feed
- Permalink
- Report Inappropriate Content
Average Column
Hi Friends
I have following pivot tbal ein my QV document
| NET_RANGE1 | Jan | Feb | Mar | Apr | May | Jun | Jul |
| <=10000 | 16 | 15 | 15 | 14 | 16 | 15 | 15 |
| 10,001-25,000 | 57 | 57 | 58 | 57 | 57 | 63 | 54 |
| 25,001-50,000 | 63 | 66 | 68 | 70 | 66 | 79 | 69 |
| 50,001-500,000 | 158 | 165 | 182 | 164 | 165 | 196 | 189 |
| Above 500,001 | 51 | 68 | 37 | 90 | 66 | 77 | 87 |
| Total | 345 | 371 | 360 | 396 | 369 | 429 | 415 |
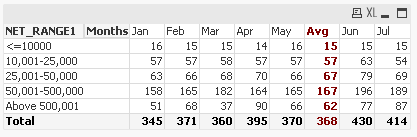
I want add another column(avg) in between months of May and Jun where total upto may divided by 5 should be shown. The resuting table should look like one given below
| NET_RANGE1 | Jan | Feb | Mar | Apr | May | Avg | Jun | Jul |
| <=10000 | 16 | 15 | 15 | 14 | 16 | 15 | 15 | 15 |
| 10,001-25,000 | 57 | 57 | 58 | 57 | 57 | 57 | 63 | 54 |
| 25,001-50,000 | 63 | 66 | 68 | 70 | 66 | 66 | 79 | 69 |
| 50,001-500,000 | 158 | 165 | 182 | 164 | 165 | 167 | 196 | 189 |
| Above 500,001 | 51 | 68 | 37 | 90 | 66 | 62 | 77 | 87 |
| Total | 345 | 371 | 360 | 396 | 369 | 368 | 429 | 415 |
Pls help to do the above in Pivot table
- Mark as New
- Bookmark
- Subscribe
- Mute
- Subscribe to RSS Feed
- Permalink
- Report Inappropriate Content
Hi,
You can load this way
MonthMap: //Mapping Table used for data loading
Mapping
LOAD * Inline
[
Months,NMonth
Jan,1
Feb,2
Mar,3
Apr,4
May,5
Jun,6
Jul,7
];
SortOrder: //For New SortOrder with Avg column
LOAD * Inline
[
Months,SOrder
Jan,1
Feb,2
Mar,3
Apr,4
May,5
Avg,6
Jun,7
Jul,8
];
Data: //Main Fact table
LOAD NET_RANGE1,
Months,
ApplyMap('MonthMap',Months) as NMonth,
Values
FROM
(
//Load only data upto May and do calculation for the Avg
Join (Data)
LOAD
NET_RANGE1,
'Avg' as Months,
Sum(Values) / Count(Months) as Values
Resident Data
Where NMonth <= 5
Group By NET_RANGE1;
Output You get this way:-
Regards
Anand
- Mark as New
- Bookmark
- Subscribe
- Mute
- Subscribe to RSS Feed
- Permalink
- Report Inappropriate Content
Did you check this solution for your Average problem.
Regards
Anand