Unlock a world of possibilities! Login now and discover the exclusive benefits awaiting you.
- Qlik Community
- :
- All Forums
- :
- QlikView App Dev
- :
- Re: Average Display in Staright Chart showing Big ...
- Subscribe to RSS Feed
- Mark Topic as New
- Mark Topic as Read
- Float this Topic for Current User
- Bookmark
- Subscribe
- Mute
- Printer Friendly Page
- Mark as New
- Bookmark
- Subscribe
- Mute
- Subscribe to RSS Feed
- Permalink
- Report Inappropriate Content
Average Display in Staright Chart showing Big Differnce.!!!
Hi Folks,
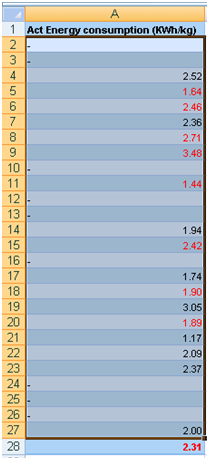
I'm calling an expression as Avg(Act_Energy_Consumption) in a straight table. Whatever the average value I'm getting at he bottom is showing me big difference from the actual. Here below if you can see Actual average of selected number is 2.19 but Qlikview is showing 2.31 which is big difference. Kindly help me on this .
Thanks,
Amit
Accepted Solutions
- Mark as New
- Bookmark
- Subscribe
- Mute
- Subscribe to RSS Feed
- Permalink
- Report Inappropriate Content
Hi Amit,
please check "Total Mode"on Expression Tab for the according expression. May be you need "Average of rows" instead of the default "Expression Total"
HtH
Roland
- Mark as New
- Bookmark
- Subscribe
- Mute
- Subscribe to RSS Feed
- Permalink
- Report Inappropriate Content
Hi Amit,
please check "Total Mode"on Expression Tab for the according expression. May be you need "Average of rows" instead of the default "Expression Total"
HtH
Roland
- Mark as New
- Bookmark
- Subscribe
- Mute
- Subscribe to RSS Feed
- Permalink
- Report Inappropriate Content
Thanks Roland ..!!!
- Mark as New
- Bookmark
- Subscribe
- Mute
- Subscribe to RSS Feed
- Permalink
- Report Inappropriate Content
Roland's answer will give you an answer that matches Excel - and that may be what you need. However, often the Expression total may be more accurate.
Picture you have this data:
A 2
A 2
A 2
A 2
B 8
When you do an Avg of the value in a table QlikView will show two rows like this:
A 2
B 8
A being the average of the four rows, and B being the one value.
Avg of Rows will give you 5 and the Expression Total will give you 3.2.
The first answer will reconcile with what you get in Excel - but the second is most likely more what you are looking for? It does depend what you are trying to achieve though
Hope that helps.
Steve