Unlock a world of possibilities! Login now and discover the exclusive benefits awaiting you.
- Qlik Community
- :
- All Forums
- :
- QlikView App Dev
- :
- Average Trendline isn't working properly
- Subscribe to RSS Feed
- Mark Topic as New
- Mark Topic as Read
- Float this Topic for Current User
- Bookmark
- Subscribe
- Mute
- Printer Friendly Page
- Mark as New
- Bookmark
- Subscribe
- Mute
- Subscribe to RSS Feed
- Permalink
- Report Inappropriate Content
Average Trendline isn't working properly
Hello all,
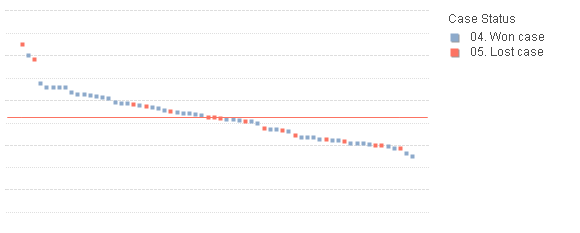
I have thes following graph which is showing only one average trendline instead of two:

It has two expressions, one for custom data labels and another with the data being displayed. If I remove the labeling expression it begins to show the 2nd trendline. Any ideas how to fix this?
The expression for this data is really long, but we can summarize it by a simple SUM:
=Sum ([Customer end-price])
The label expression is:
='Customer End Price: '&Sum ([Customer end-price]) &chr(10)
& Customer &chr(10)
&'Sales Area: ' &[SALES AREA] &chr(10)
&'Case #: ' &[ST Case Number] &chr(10)
- « Previous Replies
-
- 1
- 2
- Next Replies »
Accepted Solutions
- Mark as New
- Bookmark
- Subscribe
- Mute
- Subscribe to RSS Feed
- Permalink
- Report Inappropriate Content
I have tried quite a few things, but not able to make this work... but one thing I found was the you have used this as your environment variables
SET ThousandSep=',';
SET DecimalSep=',';
SET MoneyThousandSep='.';
SET MoneyDecimalSep=',';
SET MoneyFormat='R$ #.##0,00;-R$ #.##0,00';
SET TimeFormat='hh:mm:ss';
SET DateFormat='DD/MM/YYYY';
SET TimestampFormat='DD/MM/YYYY hh:mm:ss[.fff]';
SET MonthNames='jan;feb;mar;apr;may;jun;jul;aug;sep;oct;nov;dec';
SET DayNames='mon;tue;wed;thu;fri;sat;sun';
I am guessing that you don't want your Thousand and Decimal Separators to be comma. Do you know what you have to use? I would suggest fixing this in the script so that you can save some trouble later. Similarly make sure Money separators look good to....
I changed the above to this
SET ThousandSep=',';
SET DecimalSep='.';
SET MoneyThousandSep=',';
SET MoneyDecimalSep='.';
SET MoneyFormat='R$ #.##0,00;-R$ #.##0,00';
SET TimeFormat='hh:mm:ss';
SET DateFormat='DD/MM/YYYY';
SET TimestampFormat='DD/MM/YYYY hh:mm:ss[.fff]';
SET MonthNames='jan;feb;mar;apr;may;jun;jul;aug;sep;oct;nov;dec';
SET DayNames='mon;tue;wed;thu;fri;sat;sun';
And using this expression
Dual(
text('Customer End Price (in M')&vCurrency&'): '
&num(if([Offer Currency]=vCurrency,
sum([Customer end-price]/1000000),
sum([Customer end-price]/[Rate /EUR]* if(CurrencyCheck=vCurrency,RateCheck)/1000000))
,'#,##0.00')
&chr(10)
&'Customer: ' &Customer
&chr(10)
&'Sales Area: ' &[Sales Area]
&chr(10)
&'Case #: ' &[ST Case Number]
,
num(if([Offer Currency]=vCurrency,
sum([Customer end-price]/1000000),
sum([Customer end-price]/[Rate /EUR]* if(CurrencyCheck=vCurrency,RateCheck/1000000)))
,'#,##0.00')
)
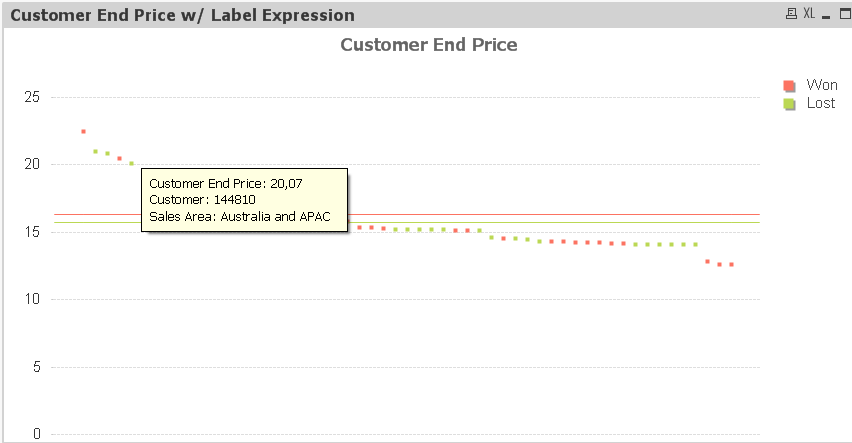
I get this
I am still unable to increase the number of decimals you would want to see, but atleast this works without having to add steps on the Axis tab.
- Mark as New
- Bookmark
- Subscribe
- Mute
- Subscribe to RSS Feed
- Permalink
- Report Inappropriate Content
Would you be able to share a sample to show the issue?
- Mark as New
- Bookmark
- Subscribe
- Mute
- Subscribe to RSS Feed
- Permalink
- Report Inappropriate Content
Here you have an example with the two graphs
- Mark as New
- Bookmark
- Subscribe
- Mute
- Subscribe to RSS Feed
- Permalink
- Report Inappropriate Content
Try this

- Mark as New
- Bookmark
- Subscribe
- Mute
- Subscribe to RSS Feed
- Permalink
- Report Inappropriate Content
And add pop-up label here instead

- Mark as New
- Bookmark
- Subscribe
- Mute
- Subscribe to RSS Feed
- Permalink
- Report Inappropriate Content
I think you will have to rebuild the avg trendlines in order not to loose your popup informations.
1. Expression
'Customer End Price: ' &sum([Customer End Price]) &chr(10)
&'Customer: ' &[Case #] &chr(10)&
'Sales Area: ' &[Sales Area]
2. Expression (activate avg-Trendline)
Sum({<[Case Status]={'Won'}>}[Customer End Price])/count({<[Case Status]={'Won'},[Case #]={'=[Case #]>0'}>}[Customer End Price])
3. Expression (activate avg-Trendline)
Sum({<[Case Status]={'Lost'}>}[Customer End Price])/count({<[Case Status]={'Lost'},[Case #]={'=[Case #]>0'}>}[Customer End Price])

- Mark as New
- Bookmark
- Subscribe
- Mute
- Subscribe to RSS Feed
- Permalink
- Report Inappropriate Content
If I do so not all info I want to see in the pop-up label will appear and for line charts the custom labels only work if the expression is the first one
- Mark as New
- Bookmark
- Subscribe
- Mute
- Subscribe to RSS Feed
- Permalink
- Report Inappropriate Content
How about if you use this as your expression and disable the other expression
Dual(
'Customer End Price: ' &sum([Customer End Price]) &chr(10)
&'Customer: ' &[Case #] &chr(10)&
'Sales Area: ' &[Sales Area],
Sum([Customer End Price]))
- Mark as New
- Bookmark
- Subscribe
- Mute
- Subscribe to RSS Feed
- Permalink
- Report Inappropriate Content
That workd for the average lines, but now the X-axis is not showing the values correctly.
- Mark as New
- Bookmark
- Subscribe
- Mute
- Subscribe to RSS Feed
- Permalink
- Report Inappropriate Content
I don't see any value for x-axis...
- « Previous Replies
-
- 1
- 2
- Next Replies »