Unlock a world of possibilities! Login now and discover the exclusive benefits awaiting you.
- Qlik Community
- :
- All Forums
- :
- QlikView App Dev
- :
- Average Weekly
- Subscribe to RSS Feed
- Mark Topic as New
- Mark Topic as Read
- Float this Topic for Current User
- Bookmark
- Subscribe
- Mute
- Printer Friendly Page
- Mark as New
- Bookmark
- Subscribe
- Mute
- Subscribe to RSS Feed
- Permalink
- Report Inappropriate Content
Average Weekly
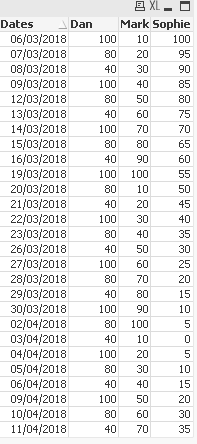
How can I get in a Straight table weekly average from a daily observation?
so from
to
I started with a cross table but then got stuck...
Many thanks
Raphael
- « Previous Replies
-
- 1
- 2
- Next Replies »
Accepted Solutions
- Mark as New
- Bookmark
- Subscribe
- Mute
- Subscribe to RSS Feed
- Permalink
- Report Inappropriate Content
- Mark as New
- Bookmark
- Subscribe
- Mute
- Subscribe to RSS Feed
- Permalink
- Report Inappropriate Content
I meant not weekly average but rather 5 days average.
- Mark as New
- Bookmark
- Subscribe
- Mute
- Subscribe to RSS Feed
- Permalink
- Report Inappropriate Content
How are you coming up with 90 for Dan on 07/03/2018?
- Mark as New
- Bookmark
- Subscribe
- Mute
- Subscribe to RSS Feed
- Permalink
- Report Inappropriate Content
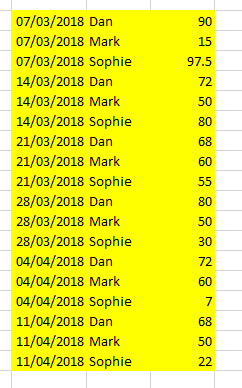
07/03/2018 only 2 data in past so average of 80 and 100 = 90
14/03/2018 we have full 5 data points so average of 100,40,80,100,40 = 72
thanks
- Mark as New
- Bookmark
- Subscribe
- Mute
- Subscribe to RSS Feed
- Permalink
- Report Inappropriate Content
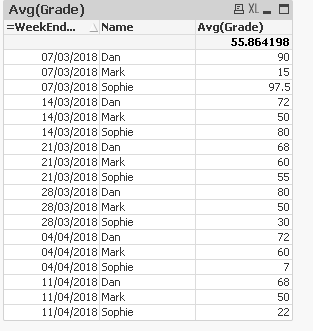
Try this
Dimension
=WeekEnd(Dates, 0, 3)
Name
Expression
Avg(Grade)
- Mark as New
- Bookmark
- Subscribe
- Mute
- Subscribe to RSS Feed
- Permalink
- Report Inappropriate Content
Amazing!
- Mark as New
- Bookmark
- Subscribe
- Mute
- Subscribe to RSS Feed
- Permalink
- Report Inappropriate Content
Sunny,
My requirement actually sometime may need to be instead of 5 day 9 days or 13 day or something else. I don't think that with WeekEnd I will be able to adjust, is there any other way that the '5' will be in the formula? thank you
- Mark as New
- Bookmark
- Subscribe
- Mute
- Subscribe to RSS Feed
- Permalink
- Report Inappropriate Content
You can do that, but against which date in the dimension would you want to group them? I mean how did you know that 07/03/2018 is the date which you want to see and not 06/03/2018?
- Mark as New
- Bookmark
- Subscribe
- Mute
- Subscribe to RSS Feed
- Permalink
- Report Inappropriate Content
because I go by last date - which saw 11/04/2018 the this date + 4 dates above average and so on
- Mark as New
- Bookmark
- Subscribe
- Mute
- Subscribe to RSS Feed
- Permalink
- Report Inappropriate Content
Guess best to do that in the load script itself rather than in the dimension?
What do you think?
- « Previous Replies
-
- 1
- 2
- Next Replies »