Unlock a world of possibilities! Login now and discover the exclusive benefits awaiting you.
- Qlik Community
- :
- All Forums
- :
- QlikView App Dev
- :
- Average Weekly
- Subscribe to RSS Feed
- Mark Topic as New
- Mark Topic as Read
- Float this Topic for Current User
- Bookmark
- Subscribe
- Mute
- Printer Friendly Page
- Mark as New
- Bookmark
- Subscribe
- Mute
- Subscribe to RSS Feed
- Permalink
- Report Inappropriate Content
Average Weekly
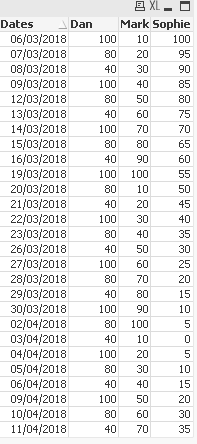
How can I get in a Straight table weekly average from a daily observation?
so from
to
I started with a cross table but then got stuck...
Many thanks
Raphael
- « Previous Replies
-
- 1
- 2
- Next Replies »
- Mark as New
- Bookmark
- Subscribe
- Mute
- Subscribe to RSS Feed
- Permalink
- Report Inappropriate Content
May be... but I am not sure how you will do this with different options you want your user to have... 5, 9 or 13?
- Mark as New
- Bookmark
- Subscribe
- Mute
- Subscribe to RSS Feed
- Permalink
- Report Inappropriate Content
I'll have to redo the load each time I want to change my parameter...
I tried to do it via loading script - to reduce my data and make it 5 days average but did not manage though
- Mark as New
- Bookmark
- Subscribe
- Mute
- Subscribe to RSS Feed
- Permalink
- Report Inappropriate Content
Hello Raphael,
First you would have to create a Week field, to do so you can simply use the Week function: https://help.qlik.com/en-US/qlikview/November2017/Subsystems/Client/Content/Scripting/DateAndTimeFun...
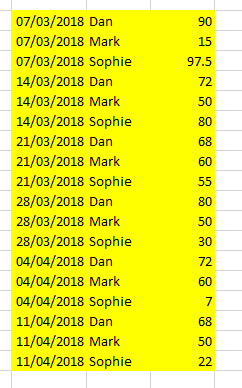
Once you've done that you would simply calculate the average grade per week per student using the Group By function in the back end: https://help.qlik.com/en-US/qlikview/November2017/Subsystems/Client/Content/Scripting/ScriptRegularS...
OR you can also you the AGGR function in the front end: https://help.qlik.com/en-US/qlikview/November2017/Subsystems/Client/Content/ChartFunctions/aggr.htm
The Group By option is probably the simplest, that is the option I used in the example attached. I just used that default week function, but can customize that to your needs by following the guide linked above.
And in case you are not able to open the QVW file, here is the load script I use:
// ORIGINAL SCRIPT
Source:
LOAD * INLINE [
Dates, Dan, Mark, Sophie
06/03/2018, 100, 10, 100
07/03/2018, 80, 20, 95
08/03/2018, 40, 30, 90
09/03/2018, 100, 40, 85
12/03/2018, 80, 50, 80
13/03/2018, 40, 60, 75
14/03/2018, 100, 70, 70
15/03/2018, 80, 80, 65
16/03/2018, 40, 90, 60
19/03/2018, 100, 100, 55
20/03/2018, 80, 10, 50
21/03/2018, 40, 20, 45
22/03/2018, 100, 30, 40
23/03/2018, 80, 40, 35
26/03/2018, 40, 50, 30
27/03/2018, 100, 60, 25
28/03/2018, 80, 70, 20
29/03/2018, 40, 80, 15
30/03/2018, 100, 90, 10
02/04/2018, 80, 100, 5
03/04/2018, 40, 10, 0
04/04/2018, 100, 20, 5
05/04/2018, 80, 30, 10
06/04/2018, 40, 40, 15
09/04/2018, 100, 50, 20
10/04/2018, 80, 60, 30
11/04/2018, 40, 70, 35
];
MyData:
CrossTable(Name,Grade)
Load * Resident Source;
drop Table Source;
// END OF ORIGINAL SCRIPT
JOIN(MyData)
LOAD Dates,
Week(Dates) AS Week
Resident MyData;
LEFT JOIN(MyData)
LOAD Week,
Name,
AVG(Grade) AS AvgGrade
Resident MyData Group By Week,Name;
- Mark as New
- Bookmark
- Subscribe
- Mute
- Subscribe to RSS Feed
- Permalink
- Report Inappropriate Content
Great idea!
How would I deal with with different year, so if more that one year in my observation - the week will be wrong,no?
- Mark as New
- Bookmark
- Subscribe
- Mute
- Subscribe to RSS Feed
- Permalink
- Report Inappropriate Content
In that case, you can create a Year dimension as well and added that to the Group By statement.
Or it's probably the easiest in the front end if you create a dimension such as YearWeek (ex. 2018-W1) using the DUAL function: https://help.qlik.com/en-US/qlikview/November2017/Subsystems/Client/Content/Scripting/FormattingFunc...
Dual(WeekYear(Dates) & '-W' & Week(Dates), WeekStart(Date)) as YearWeek
- Mark as New
- Bookmark
- Subscribe
- Mute
- Subscribe to RSS Feed
- Permalink
- Report Inappropriate Content
Many thanks
- « Previous Replies
-
- 1
- 2
- Next Replies »