Unlock a world of possibilities! Login now and discover the exclusive benefits awaiting you.
- Qlik Community
- :
- All Forums
- :
- QlikView App Dev
- :
- Re: Average hour of the day plot
- Subscribe to RSS Feed
- Mark Topic as New
- Mark Topic as Read
- Float this Topic for Current User
- Bookmark
- Subscribe
- Mute
- Printer Friendly Page
- Mark as New
- Bookmark
- Subscribe
- Mute
- Subscribe to RSS Feed
- Permalink
- Report Inappropriate Content
Average hour of the day plot
Hi
I have an expression to show the average time of day an event occurred :
=time(avg([Updated Time]),'hh:mm')
What I would like to show is a line chart with the Monday to Sunday along the x axis and show the average Updated Time as a line across the days. Is this possibe?
Thanks,
Phil
- Mark as New
- Bookmark
- Subscribe
- Mute
- Subscribe to RSS Feed
- Permalink
- Report Inappropriate Content
May be create Dimension as Days and use same formula as expression
- Mark as New
- Bookmark
- Subscribe
- Mute
- Subscribe to RSS Feed
- Permalink
- Report Inappropriate Content
Hi Thanks for your reply,
I have tried
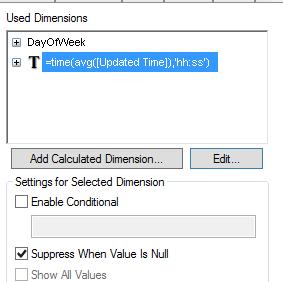
which now gives this :
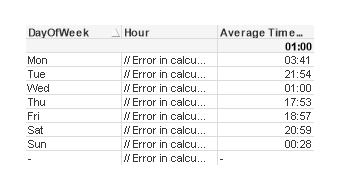
Can you help?
Thanks
Phil
- Mark as New
- Bookmark
- Subscribe
- Mute
- Subscribe to RSS Feed
- Permalink
- Report Inappropriate Content
Hi Phil,
Try to use this
=time(aggr(avg(Updated_Time),DayOfWeek),'hh:ss')
else Can you upload a sample here.
Rgds,
Tharindu
- Mark as New
- Bookmark
- Subscribe
- Mute
- Subscribe to RSS Feed
- Permalink
- Report Inappropriate Content
Hi,
is this the Expression ?
- Mark as New
- Bookmark
- Subscribe
- Mute
- Subscribe to RSS Feed
- Permalink
- Report Inappropriate Content
=time(aggr(avg(Updated_Time),DayOfWeek),'hh:ss')
- Mark as New
- Bookmark
- Subscribe
- Mute
- Subscribe to RSS Feed
- Permalink
- Report Inappropriate Content
Use DayOfWeek as dimension
and =time(avg([Updated Time]),'hh:mm') as expression