Unlock a world of possibilities! Login now and discover the exclusive benefits awaiting you.
- Qlik Community
- :
- All Forums
- :
- QlikView App Dev
- :
- Averages are different in script than the aggr fun...
- Subscribe to RSS Feed
- Mark Topic as New
- Mark Topic as Read
- Float this Topic for Current User
- Bookmark
- Subscribe
- Mute
- Printer Friendly Page
- Mark as New
- Bookmark
- Subscribe
- Mute
- Subscribe to RSS Feed
- Permalink
- Report Inappropriate Content
Averages are different in script than the aggr function?
Hi,
I am trying to build some alerts around some SPC charts and have come to the conclusion that the best way is to build some reference stats tables in the script first. (I am VERY open to other solutions if you have any!)
I have unfortunately fallen at the first fence.
When I calculate the averages for my data set using the aggr function in a chart I get the values I would expect.
But when I do the same in the script I get slightly lower values. WHY? and how do I get the right values in the script.
In the table I have
avg((aggr(count(Key),Week,Spec)))
in the script I have
AggregationTable:
Load
AggKey
, Count(Key) as RefCountAgg
Resident Referrals group by AggKey;
Left Join(AggregationTable)
Load
Left(AggKey,3) as SpecialtyAgg
, AggKey
Resident AggregationTable order by AggKey;
StatsTable:
Load
SpecialtyAgg
, avg(RefCountAgg) as Mean
Resident AggregationTable group by SpecialtyAgg;
The count values are identical in both the script generated table and the chart. it is only the average or mean values which are different.
Thanks in advance
Steve
- Mark as New
- Bookmark
- Subscribe
- Mute
- Subscribe to RSS Feed
- Permalink
- Report Inappropriate Content
Hi Steve,
Would it be possible to share a sample qvw.
Regards
Kamiel
- Mark as New
- Bookmark
- Subscribe
- Mute
- Subscribe to RSS Feed
- Permalink
- Report Inappropriate Content
Thanks for taking the time Kamiel,
I hope this helps.
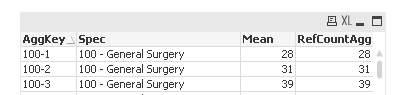
as you can see - the RefCountAgg filed is identical to those in the chart.
However the mean in the chart and in the table underneath it is different than the mean in the StatsTable in table view, generated by the script.
Regards
Steve
- Mark as New
- Bookmark
- Subscribe
- Mute
- Subscribe to RSS Feed
- Permalink
- Report Inappropriate Content
Try this:
StatsTable:
Load
SpecialtyAgg
, AggKey,
, avg(RefCountAgg) as Mean
Resident AggregationTable group by SpecialtyAgg, AggKey;
- Marcus
- Mark as New
- Bookmark
- Subscribe
- Mute
- Subscribe to RSS Feed
- Permalink
- Report Inappropriate Content
thanks Marcus, sorry I didn't come back to you - I have been away.
I tried the script you suggest but this now gives a Mean which is the same as the count...
I appreciate your time on this.
- Mark as New
- Bookmark
- Subscribe
- Mute
- Subscribe to RSS Feed
- Permalink
- Report Inappropriate Content
It's not quite clear for me which results are expected as correct. Please modify your example and replace the qvd-load with an small inline-table (maybe a few dozens or a few hundred records - just enough to be working for this purpose) and a table-chart with your aggr-expression and your now used expressions to pull the script-aggregations.
- Marcus