Unlock a world of possibilities! Login now and discover the exclusive benefits awaiting you.
- Qlik Community
- :
- All Forums
- :
- QlikView App Dev
- :
- Re: Avoid showing horizontal line in chart
- Subscribe to RSS Feed
- Mark Topic as New
- Mark Topic as Read
- Float this Topic for Current User
- Bookmark
- Subscribe
- Mute
- Printer Friendly Page
- Mark as New
- Bookmark
- Subscribe
- Mute
- Subscribe to RSS Feed
- Permalink
- Report Inappropriate Content
Avoid showing horizontal line in chart
Morning,
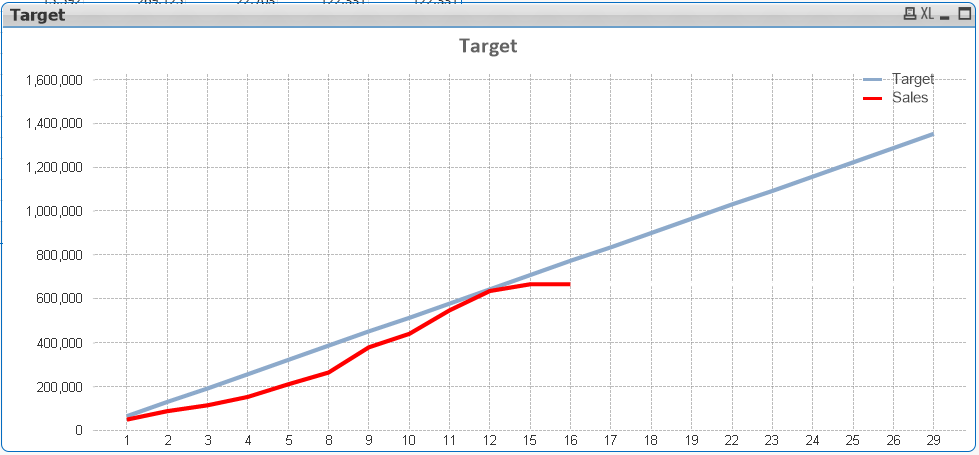
My chart shows Accumulated Targets and Sales. My expressions for Sales currently is:
=SUM({<Sales_Fin_Year={"$(=max([Display Fin Year]))"}
, Sales_Fin_Period={"$(=max(month(Today())))"}
,Date={"<$(=max(date(Today())))"}
, DocumentType={'3','4'},[Unit Sell]={'>0'} >} TotalLineSale)
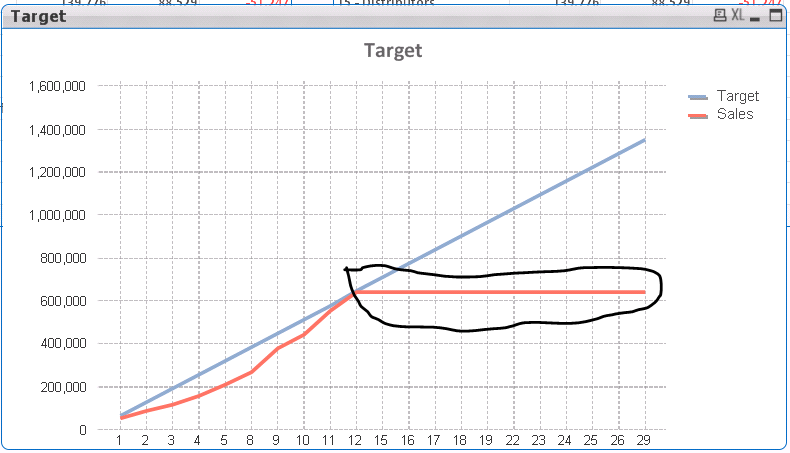
I wonder if there is a way of not showing the section of Sales line, circled in black.
Any ideas are much appreciated.
Accepted Solutions
- Mark as New
- Bookmark
- Subscribe
- Mute
- Subscribe to RSS Feed
- Permalink
- Report Inappropriate Content
Click on the + in front of the expression on the expressions tab, select Background Color, and enter an expression in the Definition input field that will make the background color 100% transparent if the current value of the expression is the same as the previous one. Something like:
=If(Above(SUM({ .... }TotalLineSale))=SUM({ .... }TotalLineSale). argb(0,0,0,0), color(2))
talk is cheap, supply exceeds demand
- Mark as New
- Bookmark
- Subscribe
- Mute
- Subscribe to RSS Feed
- Permalink
- Report Inappropriate Content
Hello Gysbert.
I was bringing in target and sales date separate. This played a bit of havoc with what I was trying to achieve in the chart. After sorting this out, your solutions works 100%, thank you.