Unlock a world of possibilities! Login now and discover the exclusive benefits awaiting you.
- Qlik Community
- :
- All Forums
- :
- QlikView App Dev
- :
- Re: Avoiding overlap of values in a line chart
- Subscribe to RSS Feed
- Mark Topic as New
- Mark Topic as Read
- Float this Topic for Current User
- Bookmark
- Subscribe
- Mute
- Printer Friendly Page
- Mark as New
- Bookmark
- Subscribe
- Mute
- Subscribe to RSS Feed
- Permalink
- Report Inappropriate Content
Avoiding overlap of values in a line chart
All,
I have a requirement to show data points on a line chart where the chart contains 3 lines, the problem as usual is overlap,
thought to use a combo chart with the data points showing on bar with offset but things are not working.
The thing is the logic of Bar offset should also work with the selections in the filter DG field.
Attaching a sample Qvw.
- Mark as New
- Bookmark
- Subscribe
- Mute
- Subscribe to RSS Feed
- Permalink
- Report Inappropriate Content
May be look at Rob's response here
- Mark as New
- Bookmark
- Subscribe
- Mute
- Subscribe to RSS Feed
- Permalink
- Report Inappropriate Content
Hi Sunny,
I have worked using the link what you have given above and added three expressions for bars, surprisingly one of the
either 3 expressions are working but if I enable they are not returning the data points,
for the same I have converted into a straight table I see the three data points in straight table.
Any thoughts on what happening if enable all three expressions ?
- Mark as New
- Bookmark
- Subscribe
- Mute
- Subscribe to RSS Feed
- Permalink
- Report Inappropriate Content
Increase the 'Max Value Shown' from 100 to 1000

- Mark as New
- Bookmark
- Subscribe
- Mute
- Subscribe to RSS Feed
- Permalink
- Report Inappropriate Content
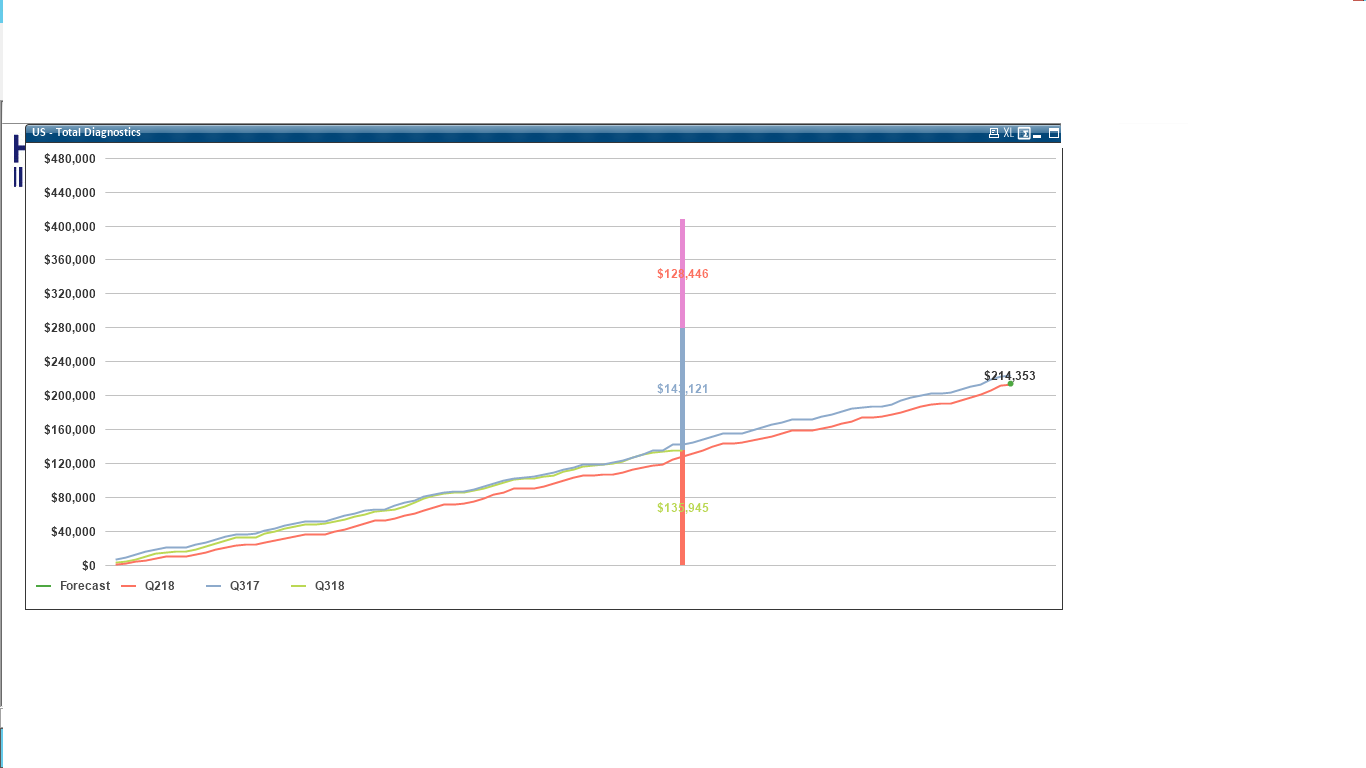
This is working fine with the sample I provided but with the actual data all three values are adding up
and even the position of legends changed not sure what happened
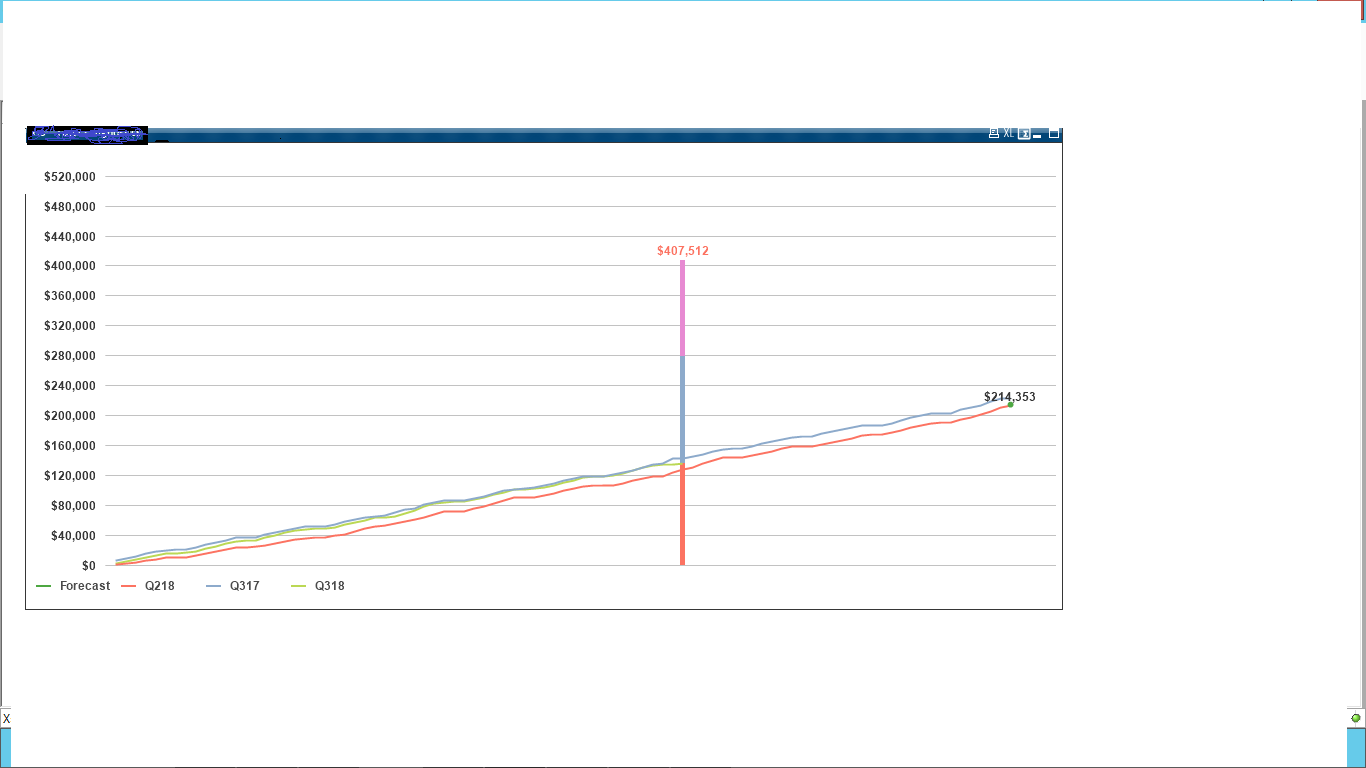
The original order for the legends is Q318 Q317 Q218 Forecast
- Mark as New
- Bookmark
- Subscribe
- Mute
- Subscribe to RSS Feed
- Permalink
- Report Inappropriate Content
That is strange, but I don't think I know what might be going on
- Mark as New
- Bookmark
- Subscribe
- Mute
- Subscribe to RSS Feed
- Permalink
- Report Inappropriate Content
I tried with Plot values inside segments option in Presentation tab but the values are too much scattered and they are not following the Y axis
- Mark as New
- Bookmark
- Subscribe
- Mute
- Subscribe to RSS Feed
- Permalink
- Report Inappropriate Content
The value 1000 you suggested earlier is something related to the values on the lines or it is independent ?
- Mark as New
- Bookmark
- Subscribe
- Mute
- Subscribe to RSS Feed
- Permalink
- Report Inappropriate Content
It means that the value on data point will only displayed if the number of data points is less than 'Max Value Shown' entered on the presentation tab
- Mark as New
- Bookmark
- Subscribe
- Mute
- Subscribe to RSS Feed
- Permalink
- Report Inappropriate Content