Unlock a world of possibilities! Login now and discover the exclusive benefits awaiting you.
- Qlik Community
- :
- All Forums
- :
- QlikView App Dev
- :
- BAR CHART PLOT AREA COLOUR BASED ON EXPRESSION
- Subscribe to RSS Feed
- Mark Topic as New
- Mark Topic as Read
- Float this Topic for Current User
- Bookmark
- Subscribe
- Mute
- Printer Friendly Page
- Mark as New
- Bookmark
- Subscribe
- Mute
- Subscribe to RSS Feed
- Permalink
- Report Inappropriate Content
BAR CHART PLOT AREA COLOUR BASED ON EXPRESSION
Hi, does anyone know if its possible to change the plot area background colour based on an expression?
Basically i want the expression to do the following -
IF Y-AXIS > 0 THEN LIGHTGREEN PLOT AREA COLOUR
IF Y-AXIS < 0 THEN LIGHTRED PLOT AREA COLOUR
I was thinking of the following calulated expression:
=IF( YAXIS >0, LIGHTGREEN(), LIGHTRED())
also see my screenshots below
--------
- « Previous Replies
-
- 1
- 2
- Next Replies »
- Mark as New
- Bookmark
- Subscribe
- Mute
- Subscribe to RSS Feed
- Permalink
- Report Inappropriate Content
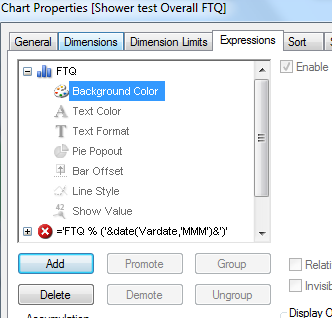
Hi Try this:
In the expression + button is there clik on it
Clik on background color & write the condition for colors in Definition........
- Mark as New
- Bookmark
- Subscribe
- Mute
- Subscribe to RSS Feed
- Permalink
- Report Inappropriate Content
That only changes the color of the bars. I'm looking for something like this: 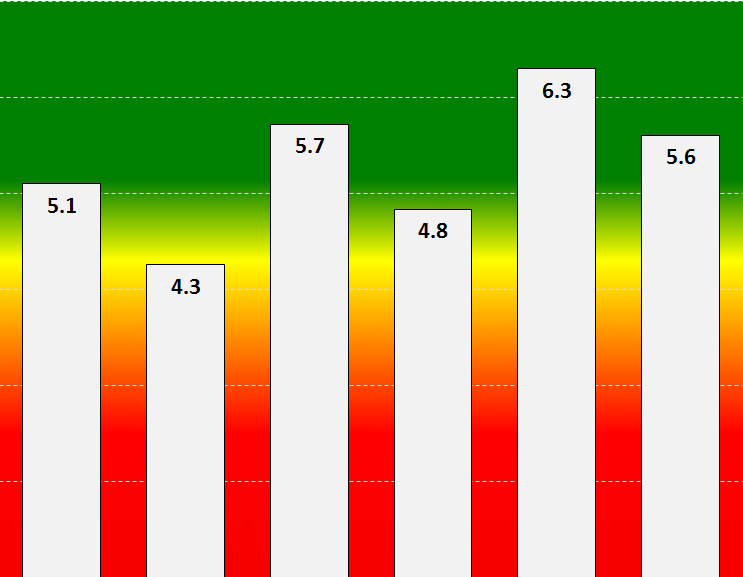
- Mark as New
- Bookmark
- Subscribe
- Mute
- Subscribe to RSS Feed
- Permalink
- Report Inappropriate Content
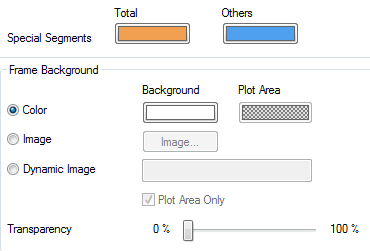
In colors tab
Chang the colors in Frame Background colors.........
- Mark as New
- Bookmark
- Subscribe
- Mute
- Subscribe to RSS Feed
- Permalink
- Report Inappropriate Content
Hi Venkata, I tried this with the Movies Database.qvw and couldn't make it work using your method. Formula of...
If(Sum(FilmCount)>10, green(),red())
attached is qvw...
- Mark as New
- Bookmark
- Subscribe
- Mute
- Subscribe to RSS Feed
- Permalink
- Report Inappropriate Content
You have Transparency 100%. Reduce it, and you'll see green. Or red, if you select few movies.
- Mark as New
- Bookmark
- Subscribe
- Mute
- Subscribe to RSS Feed
- Permalink
- Report Inappropriate Content
Changed transparency 
Unfortunately this isn't the same as the examples in this thread. It highlights background when a selection is made but we are looking for the background of the chart to be set based on the value of the expression ie if there is more than 10 movies irrespective of user selection then the background should be green else red.
- Mark as New
- Bookmark
- Subscribe
- Mute
- Subscribe to RSS Feed
- Permalink
- Report Inappropriate Content
You can do it with bar color but not with chart background. Background is one per chart - see my response above, on Nov 6, 2013.
- Mark as New
- Bookmark
- Subscribe
- Mute
- Subscribe to RSS Feed
- Permalink
- Report Inappropriate Content
Hi All,
We can change the background color of bar chart, by giving condition.
Go to color tab -> Background -> Calculated -> give the condition.
It's working for me.
Regards,
Pavan.
- « Previous Replies
-
- 1
- 2
- Next Replies »