Unlock a world of possibilities! Login now and discover the exclusive benefits awaiting you.
- Qlik Community
- :
- All Forums
- :
- QlikView App Dev
- :
- Re: [Bar Chart] Aggr Text on Axis
- Subscribe to RSS Feed
- Mark Topic as New
- Mark Topic as Read
- Float this Topic for Current User
- Bookmark
- Subscribe
- Mute
- Printer Friendly Page
- Mark as New
- Bookmark
- Subscribe
- Mute
- Subscribe to RSS Feed
- Permalink
- Report Inappropriate Content
[Bar Chart] Aggr Text on Axis
Hi everyone!
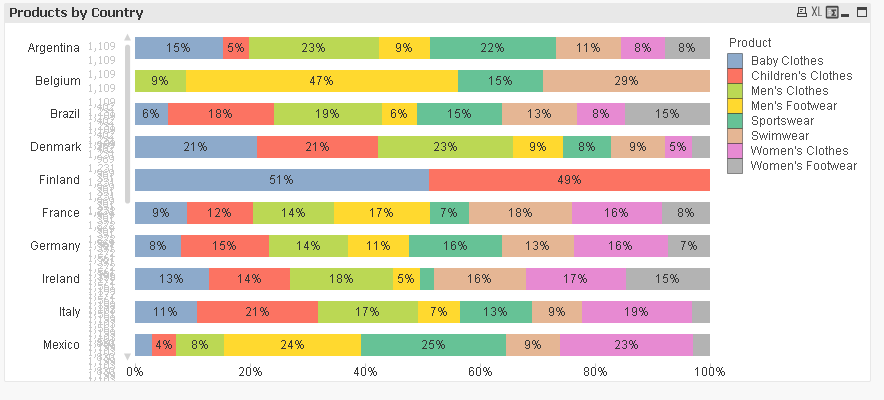
I have a bar chart showing the percentage of products by country, where I set two dimensions and expressions. One of the expressions is the total of products aggregated by country and needs to be as "text on axis".
The data is something similar to this:
| Country | Product | Value |
|---|---|---|
| Argentina | Children's Clothes | 51 |
| Argentina | Men's Clothes | 250 |
| Argentina | Women's Clothes | 86 |
| Belgium | Children's Clothes | |
| Belgium | Men's Clothes | 36 |
| Belgium | Women's Clothes | 190 |
| Canada | Children's Clothes | |
| Canada | Men's Clothes | |
| Canada | Women's Clothes |
Full data within the attachments
As you can see some countries has missing value for one or more Products.
The chart has Country and Product as dimensions (Stacked) and the two expressions are:
Exp1 : SUM(Value) / SUM(TOTAL <Country> Value)
Exp2 [Text on axis]: AGGR( SUM(Value), Country )
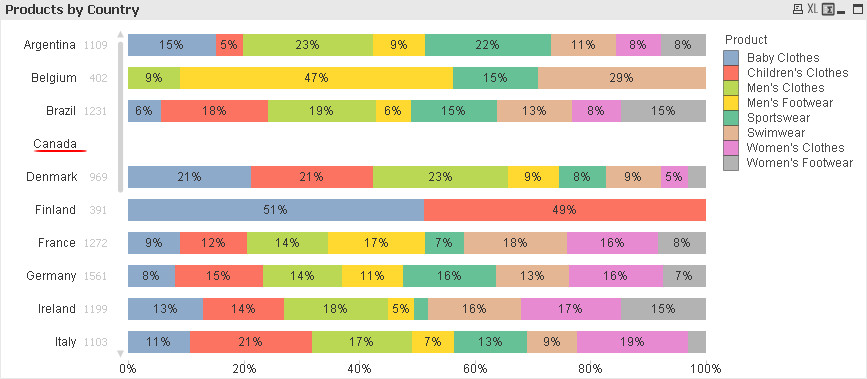
With the full data set I got this as a result:

The numbers highlighted in red have the missing symbol "-" and looks like strikethrough for the last digit.
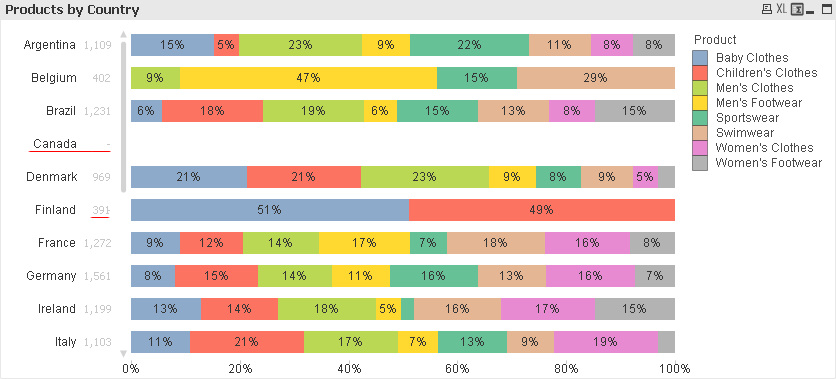
I tried to change the "Text on Axis" expression to this:
IF(ISNULL(AGGR( SUM(Value), Country )),'',AGGR( SUM(Value), Country ))
which eliminates the missing symbol, but shows the countries without values
I tried to supress that country but nothing seems to work. I don't want to use a calculated dimension and I can not eliminate the records without value because the data is dummy and the real data has more information.
Does anybody have an idea to how to deal with this?
All the test files are in the attachments.
Accepted Solutions
- Mark as New
- Bookmark
- Subscribe
- Mute
- Subscribe to RSS Feed
- Permalink
- Report Inappropriate Content
That still give me the country without values (Canada in this example) and some others still strikethrough.
With the help of my buddies in the office this problem was solved by modifying the expression to:
SUM(TOTAL <Country> AGGR(SUM(Value),Country))
All credits go to them juan.navarro84 and alejandro_fa_83
Thanks Guys ✌️
- Mark as New
- Bookmark
- Subscribe
- Mute
- Subscribe to RSS Feed
- Permalink
- Report Inappropriate Content
How about this:
If([Percent] > 0,
If(RowNo() = 1, AGGR(SUM(Value), Country), ' '))
- Mark as New
- Bookmark
- Subscribe
- Mute
- Subscribe to RSS Feed
- Permalink
- Report Inappropriate Content
That still give me the country without values (Canada in this example) and some others still strikethrough.
With the help of my buddies in the office this problem was solved by modifying the expression to:
SUM(TOTAL <Country> AGGR(SUM(Value),Country))
All credits go to them juan.navarro84 and alejandro_fa_83
Thanks Guys ✌️
- Mark as New
- Bookmark
- Subscribe
- Mute
- Subscribe to RSS Feed
- Permalink
- Report Inappropriate Content
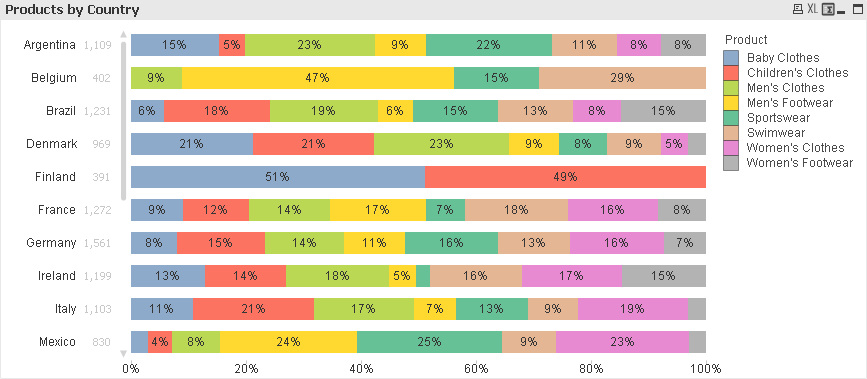
Not sure why it might have not worked for you, but this is what I see when I open the application
vs. this when I open yours 
If this worked for you,
SUM(TOTAL <Country> AGGR(SUM(Value),Country))
then you can also try this:
AGGR(NODISTINCT SUM(Value),Country)
Best,
Sunny
- Mark as New
- Bookmark
- Subscribe
- Mute
- Subscribe to RSS Feed
- Permalink
- Report Inappropriate Content
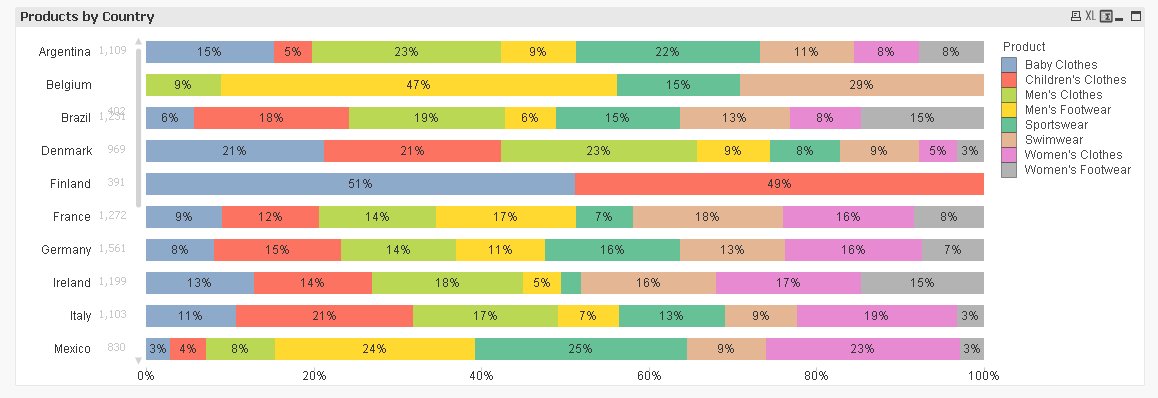
Why do you need the advanced aggregation here?
This worked for me and I would be surprised if it's not working at any site
=SUM(TOTAL <Country> Value)
- Mark as New
- Bookmark
- Subscribe
- Mute
- Subscribe to RSS Feed
- Permalink
- Report Inappropriate Content
I think is all about the QlikView version. I'm currently using v11.20 SR13 and I notice some differences vs previous builds (also with v12).
If you take a look at the first image you post, the Belgium value is moved a little bit down. I enable the fast change option in the chart so you can se what is happening in the straight table format.
The last expression that you suggest also works for me. Thanks!
- Mark as New
- Bookmark
- Subscribe
- Mute
- Subscribe to RSS Feed
- Permalink
- Report Inappropriate Content
You're absolutely right. That Also worked and I think is best approach. I will perform further test with the real data and see how it handles. Thank you for your comments.
- Mark as New
- Bookmark
- Subscribe
- Mute
- Subscribe to RSS Feed
- Permalink
- Report Inappropriate Content
Can I ask how you got the total count on the axis to be listed once and not once for each product? I do something very similar but my text on axis totals list for each of the secondary dimensions in each bar?