Unlock a world of possibilities! Login now and discover the exclusive benefits awaiting you.
- Qlik Community
- :
- All Forums
- :
- QlikView App Dev
- :
- Re: Bar Chart Dimension Issue
- Subscribe to RSS Feed
- Mark Topic as New
- Mark Topic as Read
- Float this Topic for Current User
- Bookmark
- Subscribe
- Mute
- Printer Friendly Page
- Mark as New
- Bookmark
- Subscribe
- Mute
- Subscribe to RSS Feed
- Permalink
- Report Inappropriate Content
Bar Chart Dimension Issue
Hello,
I am a beginner on QlikView, and i would to create a chart which shows the result of the 12 last "MaJ" from the "Maj" Selected (1 year period from the Maj selected) :
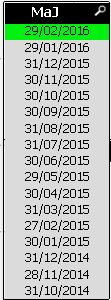
However my chart shows just the result of the MaJ selected:
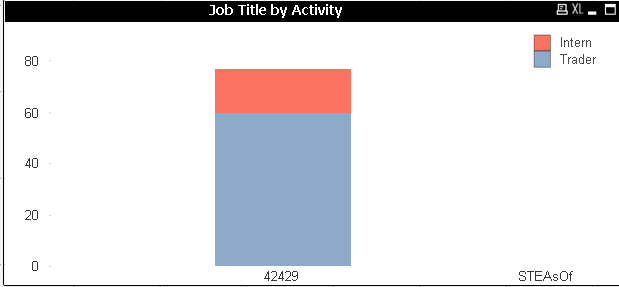
(Here "STEASoF" = "MaJ")
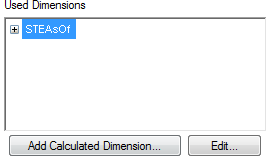
The dimension:
And the Expression looks like:

Do you have an idea ?
Thanks for advance for your help,
Cocalero.
- Mark as New
- Bookmark
- Subscribe
- Mute
- Subscribe to RSS Feed
- Permalink
- Report Inappropriate Content
I got lost ...
- Mark as New
- Bookmark
- Subscribe
- Mute
- Subscribe to RSS Feed
- Permalink
- Report Inappropriate Content
I think the attachment did not come through for some reason.
- Mark as New
- Bookmark
- Subscribe
- Mute
- Subscribe to RSS Feed
- Permalink
- Report Inappropriate Content
Stupid question: How can i post my sample please ?
- Mark as New
- Bookmark
- Subscribe
- Mute
- Subscribe to RSS Feed
- Permalink
- Report Inappropriate Content
Stupid question: How can i post my sample please ?
- Mark as New
- Bookmark
- Subscribe
- Mute
- Subscribe to RSS Feed
- Permalink
- Report Inappropriate Content
Step1:
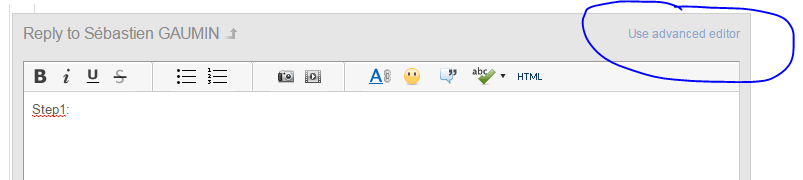
Step2:

- Mark as New
- Bookmark
- Subscribe
- Mute
- Subscribe to RSS Feed
- Permalink
- Report Inappropriate Content
Thanks a lot, here my sample:
- Mark as New
- Bookmark
- Subscribe
- Mute
- Subscribe to RSS Feed
- Permalink
- Report Inappropriate Content
Something like this?
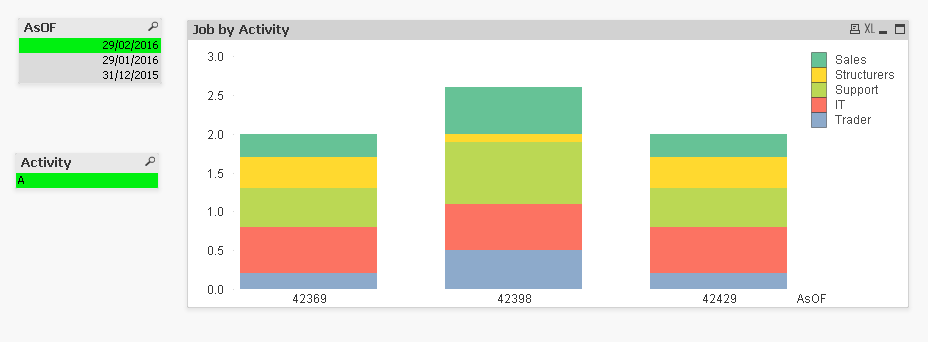
Expression
SUM({$<Job = {'Trader'}, AsOF = {$(=Max(AsOF)), $(=Max({<AsOF>}AsOF, 2)), $(=Max({<AsOF>}AsOF, 3))}>} STE)
Right now it just have set analysis for last three periods, but you can add the remaining 7 periods in your actual application.
- Mark as New
- Bookmark
- Subscribe
- Mute
- Subscribe to RSS Feed
- Permalink
- Report Inappropriate Content
Thanks for your response.
But I don't understand why "=Max({<AsOF>}AsOF, 3)" is always equal to 42369, "=Max({<AsOF>}AsOF, 2)" is always equal to 42398 too. Why it doesn't change with the selection of the AsOF.
Cocalero.
- Mark as New
- Bookmark
- Subscribe
- Mute
- Subscribe to RSS Feed
- Permalink
- Report Inappropriate Content
Or using the numeric search:
SUM({$<Job = {'Trader'}, AsOF = {">=$(=AddMonths(Max(AsOF),-2))<=$(=Max(AsOF))"}>} STE)
- Mark as New
- Bookmark
- Subscribe
- Mute
- Subscribe to RSS Feed
- Permalink
- Report Inappropriate Content
It works perfectly !!
Thanks a lot 