Unlock a world of possibilities! Login now and discover the exclusive benefits awaiting you.
- Qlik Community
- :
- All Forums
- :
- QlikView App Dev
- :
- Re: Bar Chart Expression Question
- Subscribe to RSS Feed
- Mark Topic as New
- Mark Topic as Read
- Float this Topic for Current User
- Bookmark
- Subscribe
- Mute
- Printer Friendly Page
- Mark as New
- Bookmark
- Subscribe
- Mute
- Subscribe to RSS Feed
- Permalink
- Report Inappropriate Content
Bar Chart Expression Question
I have the following data. I need an expression for a bar chart where the top of the bar for any day is the price for that day where Type=H and the bottom of the bar is the price where Type=L. You cant use where expressions so I have to find some other way. Help is much appreciated.
| Date | Type | Price |
| 3/6/2014 | H | 40.3 |
| 3/6/2014 | L | 37.2 |
| 3/7/2014 | H | 39.8 |
| 3/7/2014 | L | 36.5 |
| 3/8/2014 | H | 40.2 |
| 3/8/2014 | L | 38.2 |
| 3/9/2014 | H | 42.2 |
| 3/9/2014 | L | 40.1 |
- Tags:
- new_to_qlikview
Accepted Solutions
- Mark as New
- Bookmark
- Subscribe
- Mute
- Subscribe to RSS Feed
- Permalink
- Report Inappropriate Content
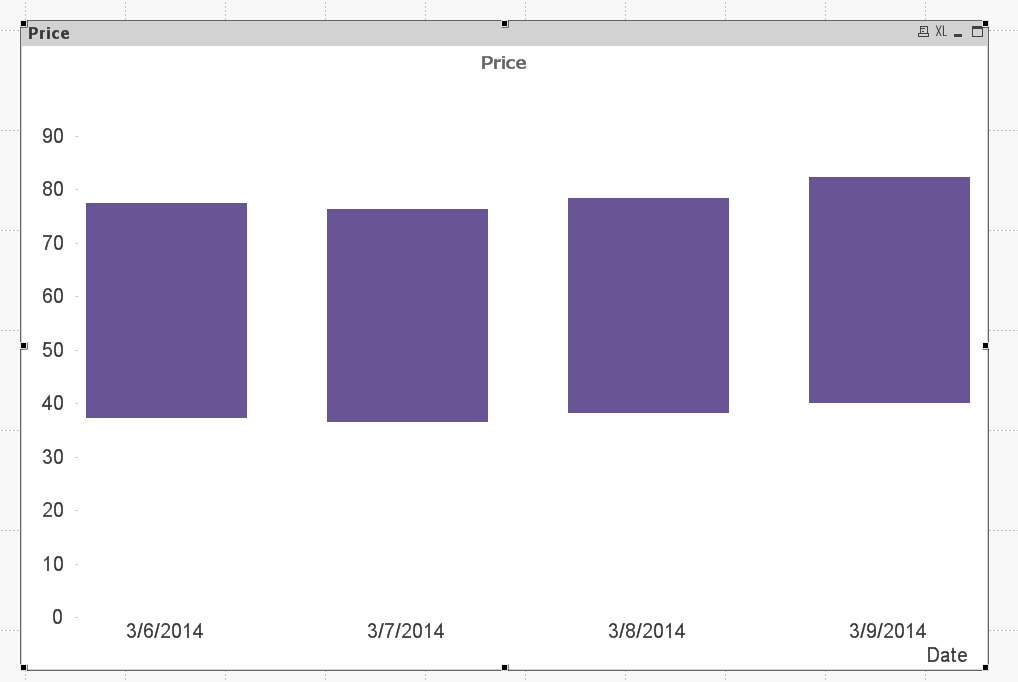
Below trick may be helpful. Properties --> Colors --> give white as first color
- Mark as New
- Bookmark
- Subscribe
- Mute
- Subscribe to RSS Feed
- Permalink
- Report Inappropriate Content
Do you want some thing like as below or different ?
- Mark as New
- Bookmark
- Subscribe
- Mute
- Subscribe to RSS Feed
- Permalink
- Report Inappropriate Content
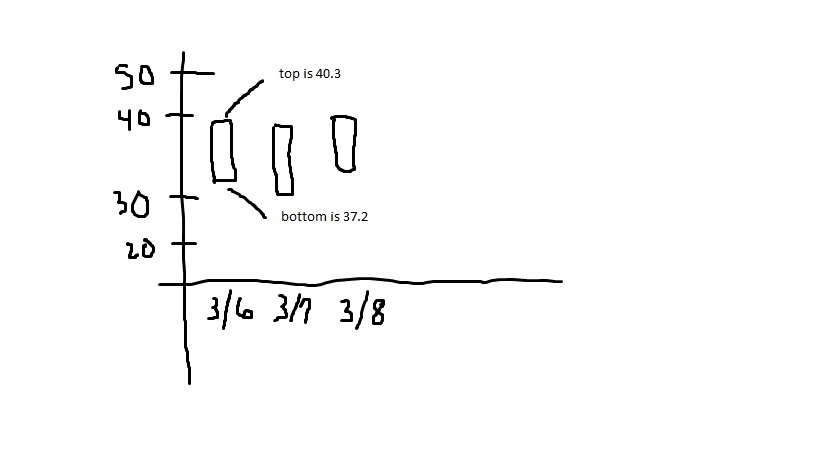
close to that except for example day 3/6/2014 the bottom of the bar is at 37.2 and the top of the bar is at 40.3. these prices are daily prices for like a stock.
- Mark as New
- Bookmark
- Subscribe
- Mute
- Subscribe to RSS Feed
- Permalink
- Report Inappropriate Content
But I could not see any value as 37.4 in your list of data....How are getting 37.4 for date 3/6/2014 ?
- Mark as New
- Bookmark
- Subscribe
- Mute
- Subscribe to RSS Feed
- Permalink
- Report Inappropriate Content
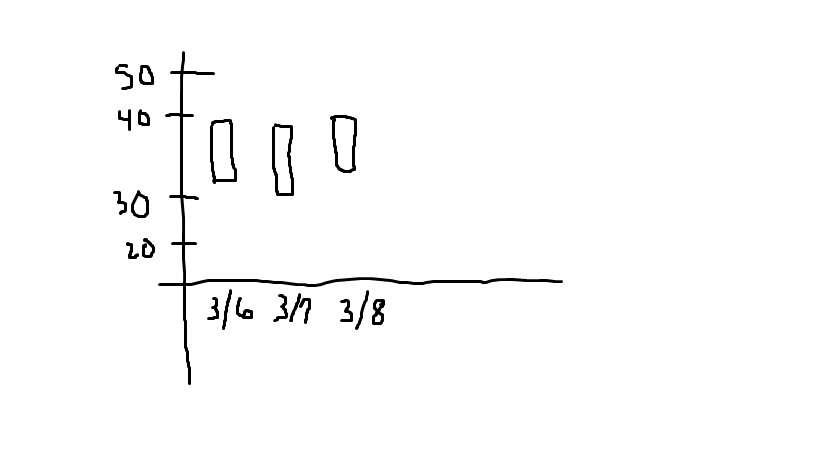
Sorry meant 37.2. For each day there is a Hi and a Low price. I am trying to build a bar chart w/ the bottom of the bar for that day at the Low price and the top of the bar at the Hi price. For day 3/6/2014 the top would be at 40.3 and the bottom at 37.2. Thanks.
- Mark as New
- Bookmark
- Subscribe
- Mute
- Subscribe to RSS Feed
- Permalink
- Report Inappropriate Content
ok...Can you add a picture of what you want exactly?
rough diagram using Paint is fine .Because my picture is showing the same ..right ?
- Mark as New
- Bookmark
- Subscribe
- Mute
- Subscribe to RSS Feed
- Permalink
- Report Inappropriate Content
- Mark as New
- Bookmark
- Subscribe
- Mute
- Subscribe to RSS Feed
- Permalink
- Report Inappropriate Content
In the chart properties, Axes tab did you try using static min and static max?
Suraj
- Mark as New
- Bookmark
- Subscribe
- Mute
- Subscribe to RSS Feed
- Permalink
- Report Inappropriate Content
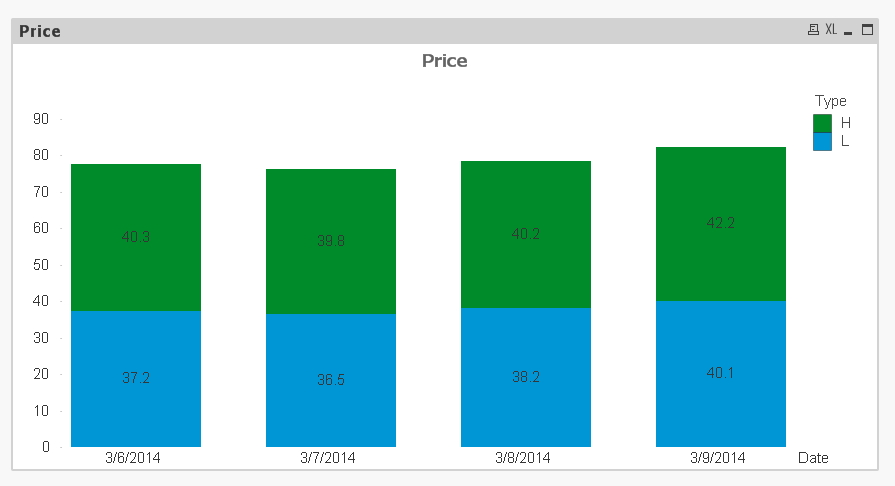
Or you can do a thing. write two expressions. One for sum of price for and another one for sum of price for 'H' -sum of price for 'L'. Go to style and make the sub type stacked. Then go to colors and make the first color transparency 100%.
Suraj
- Mark as New
- Bookmark
- Subscribe
- Mute
- Subscribe to RSS Feed
- Permalink
- Report Inappropriate Content
Below trick may be helpful. Properties --> Colors --> give white as first color