Unlock a world of possibilities! Login now and discover the exclusive benefits awaiting you.
Announcements
Qlik Open Lakehouse is Now Generally Available! Discover the key highlights and partner resources here.
- Qlik Community
- :
- All Forums
- :
- QlikView App Dev
- :
- Bar Chart - Format with 2 dimensions
Options
- Subscribe to RSS Feed
- Mark Topic as New
- Mark Topic as Read
- Float this Topic for Current User
- Bookmark
- Subscribe
- Mute
- Printer Friendly Page
Turn on suggestions
Auto-suggest helps you quickly narrow down your search results by suggesting possible matches as you type.
Showing results for
Not applicable
2017-05-10
01:53 PM
- Mark as New
- Bookmark
- Subscribe
- Mute
- Subscribe to RSS Feed
- Permalink
- Report Inappropriate Content
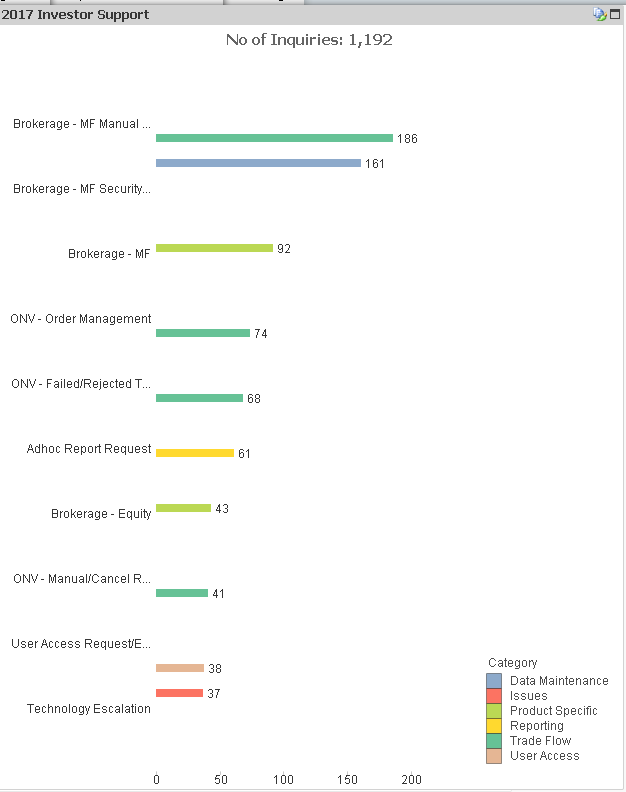
Bar Chart - Format with 2 dimensions
I have a bar chart with 2 dimensions that I would like to look cleaner / more symmetrical. This is how it currently looks.
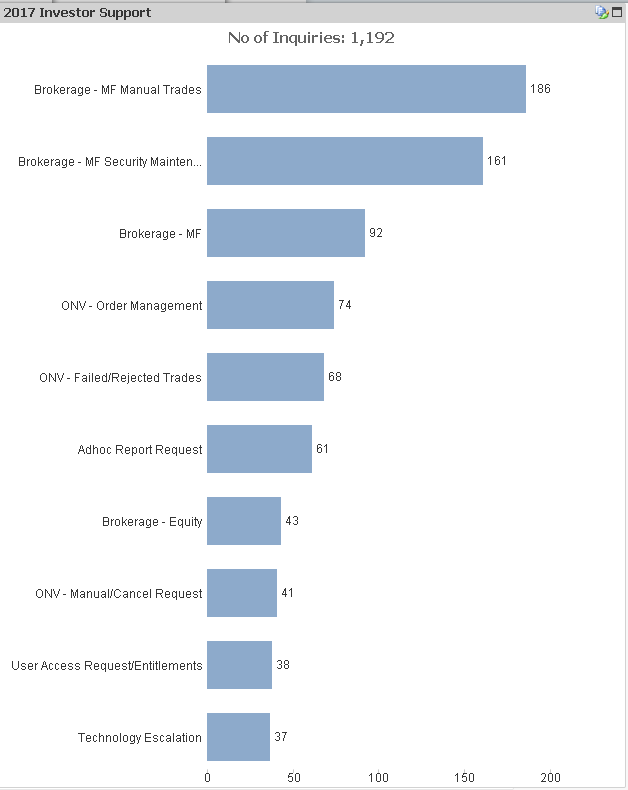
This is how I want it to look visually. I removed the category dimension for the below graph. How to I get the above graph with 2 dimensions to look more like the below graph.
367 Views
1 Reply
Partner Ambassador/MVP
2017-05-10
01:58 PM
- Mark as New
- Bookmark
- Subscribe
- Mute
- Subscribe to RSS Feed
- Permalink
- Report Inappropriate Content
Have you tried using a "Stacked" mode, instead of "Grouped" - the setting is in the Style tab of the chart properties.
cheers,
Oleg Troyansky
Upgrade your Qlik skills at the Masters Summit for Qlik - this October in Boston!
296 Views