Unlock a world of possibilities! Login now and discover the exclusive benefits awaiting you.
- Qlik Community
- :
- All Forums
- :
- QlikView App Dev
- :
- Bar Chart conditional color formatting
- Subscribe to RSS Feed
- Mark Topic as New
- Mark Topic as Read
- Float this Topic for Current User
- Bookmark
- Subscribe
- Mute
- Printer Friendly Page
- Mark as New
- Bookmark
- Subscribe
- Mute
- Subscribe to RSS Feed
- Permalink
- Report Inappropriate Content
Bar Chart conditional color formatting
Hi,
I am trying to build a bar chart where the color will depend of a creteria that goes: if the sum > 40 then 'green' else 'red'. The color area is calculated with the following: "if( Sum (Sales) > 40, green(),red())". It looks like it colors all the bar with the sum condition representing the total on the chart, not the individual bars. What am I missing? In the attached qvw, bars are green when no selection is done, red when for example 'Germany' selected and also red when both 'Germany' and 'Switzerland' selected. If you add 'France', it all turns to green.
Thanks!
- « Previous Replies
-
- 1
- 2
- Next Replies »
- Mark as New
- Bookmark
- Subscribe
- Mute
- Subscribe to RSS Feed
- Permalink
- Report Inappropriate Content
Hi Patrick
Find the attachment you will get your solution.
thanks
Zaman
- Mark as New
- Bookmark
- Subscribe
- Mute
- Subscribe to RSS Feed
- Permalink
- Report Inappropriate Content
Hi Patrick,
Whatever you have done is fine. when no selections are made, the chart shows you the total sum of sales value and it is above 40. That is why it is green in color. But when you select one by one, then it is showing red color representing that the values are less than 40. So as it is the graph is well and fine.
Thanks Joseph......
- Mark as New
- Bookmark
- Subscribe
- Mute
- Subscribe to RSS Feed
- Permalink
- Report Inappropriate Content
I hope the following set analysis may be helpful for you.
sum( {1} Sales )
returns total sales within the application, disregarding the selection but not the dimension. If used in a chart with e.g. Products as dimension, each product will get a different value.
sum( {1} Total Sales )
returns total sales within the application, disregarding both selection and dimension. I.e. the same as sum(All Sales).
- Mark as New
- Bookmark
- Subscribe
- Mute
- Subscribe to RSS Feed
- Permalink
- Report Inappropriate Content
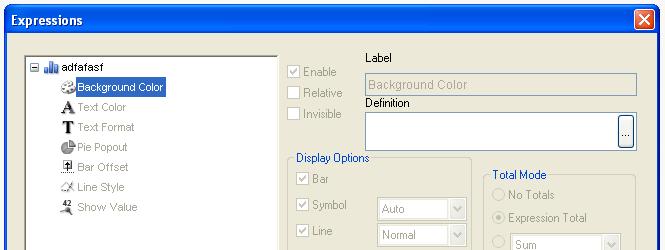
Sounds like yo have put the color expression in the wrong place, it should be put in the Background Color subexpression on the expressions page.
- Mark as New
- Bookmark
- Subscribe
- Mute
- Subscribe to RSS Feed
- Permalink
- Report Inappropriate Content
Hi there, I have the same issue, this time with using minichart representations of values given a certain dimension (time, for example). Is it not possible to conditionally colour each bar based on its given value? Using Background colour of the measure expression does not work in this case, because there are many bars (one per month), not just the one. Using the colour expression within the minichart properties does not work because it aggregates the expression (does not take into account the dimension of the minichart) and applies the same colour based on the total to all the bars.
Thanks
Das
- Mark as New
- Bookmark
- Subscribe
- Mute
- Subscribe to RSS Feed
- Permalink
- Report Inappropriate Content
Hi,
You need to give formula on "Background color" in Exprssion.
See the attachment.
Lumen
- Mark as New
- Bookmark
- Subscribe
- Mute
- Subscribe to RSS Feed
- Permalink
- Report Inappropriate Content
Hi, I'm new in Qlik View, where is "Backround color" in Expression ???
Thanks
- Mark as New
- Bookmark
- Subscribe
- Mute
- Subscribe to RSS Feed
- Permalink
- Report Inappropriate Content
Regards
Lumen
- Mark as New
- Bookmark
- Subscribe
- Mute
- Subscribe to RSS Feed
- Permalink
- Report Inappropriate Content
- « Previous Replies
-
- 1
- 2
- Next Replies »