Unlock a world of possibilities! Login now and discover the exclusive benefits awaiting you.
Announcements
FLASH SALE: Save $500! Use code FLASH2026 at checkout until Feb 14th at 11:59PM ET. Register Now!
- Qlik Community
- :
- All Forums
- :
- QlikView App Dev
- :
- Bar Chart
Options
- Subscribe to RSS Feed
- Mark Topic as New
- Mark Topic as Read
- Float this Topic for Current User
- Bookmark
- Subscribe
- Mute
- Printer Friendly Page
Turn on suggestions
Auto-suggest helps you quickly narrow down your search results by suggesting possible matches as you type.
Showing results for
Not applicable
2015-07-16
02:18 AM
- Mark as New
- Bookmark
- Subscribe
- Mute
- Subscribe to RSS Feed
- Permalink
- Report Inappropriate Content
Bar Chart
Hi
Table1:
| ALT_TIME | MAR |
| 1:00 | ABC1234 |
| 2:15 | ABC1235 |
| 13:15 | ABC1236 |
| 14:45 | ABC1237 |
| 21:05 | ABC1238 |
Table2:
| ACT_TIME | MAR |
| 1:00 | ABC1234 |
| 2:15 | ABC1235 |
| 14:15 | ABC1236 |
| 14:45 | ABC1237 |
| 22:05 | ABC1238 |
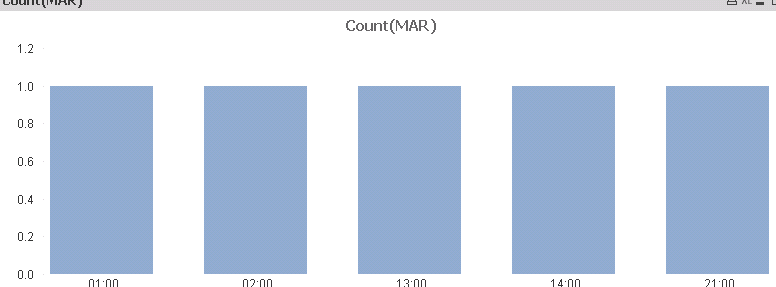
Need to create a bar chart with 1 hour time interval as dimension , and count of MAR in table 1 and table 2 as a BAR or Line
627 Views
2 Replies
Partner - Specialist II
2015-07-16
02:24 AM
- Mark as New
- Bookmark
- Subscribe
- Mute
- Subscribe to RSS Feed
- Permalink
- Report Inappropriate Content
You can use class function to do this. refer Class function
Can be done using Interval function as well
405 Views
Anonymous
Not applicable
2015-07-16
02:42 AM
Author
- Mark as New
- Bookmark
- Subscribe
- Mute
- Subscribe to RSS Feed
- Permalink
- Report Inappropriate Content
is this you are looking for
405 Views