Unlock a world of possibilities! Login now and discover the exclusive benefits awaiting you.
- Qlik Community
- :
- All Forums
- :
- QlikView App Dev
- :
- Re: Bar/Symbol Chart Possibilities
- Subscribe to RSS Feed
- Mark Topic as New
- Mark Topic as Read
- Float this Topic for Current User
- Bookmark
- Subscribe
- Mute
- Printer Friendly Page
- Mark as New
- Bookmark
- Subscribe
- Mute
- Subscribe to RSS Feed
- Permalink
- Report Inappropriate Content
Bar/Symbol Chart Possibilities
Hey All,
I am trying to create a Milestone/Gantt Chart visualization and I was wondering if anyone knows if the following can be performed using a single chart?
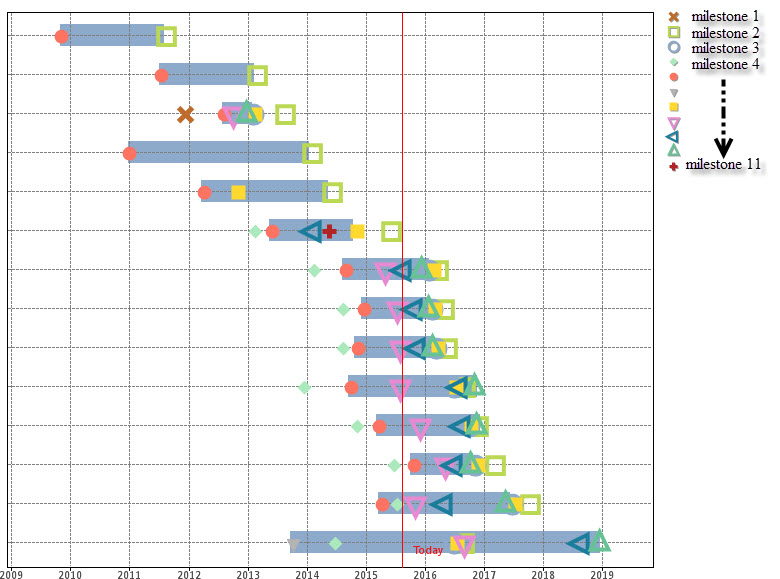
currently I am producing this by overlaying two charts, one for the bar one for the symbols - works well except when you try to scroll, only the top image scrolls disassociating the data.
when I try to put the same info into a line bar chart I get the following:
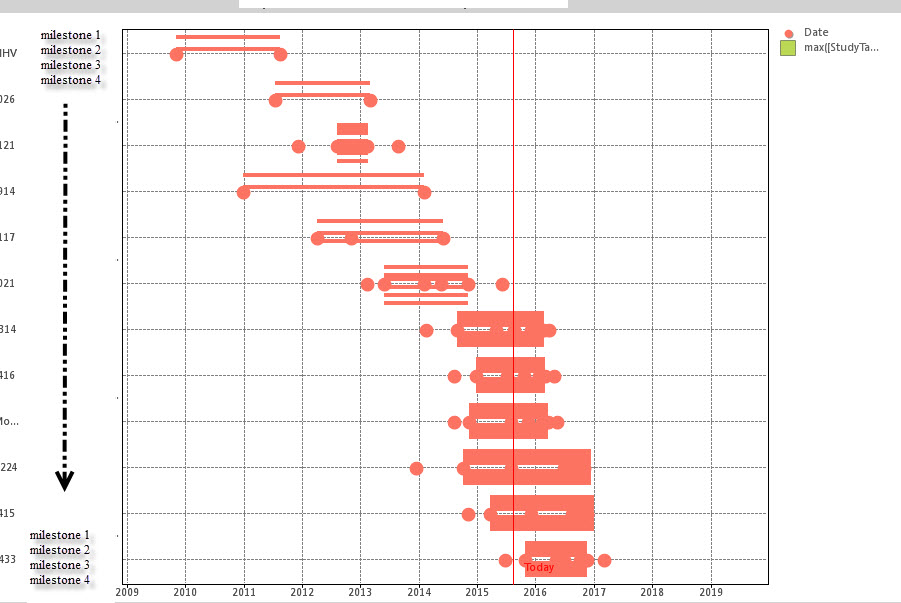
any ideas would be greatly appreciated
Thanks,
Vince
- Tags:
- qlikview_scripting
- « Previous Replies
-
- 1
- 2
- Next Replies »
- Mark as New
- Bookmark
- Subscribe
- Mute
- Subscribe to RSS Feed
- Permalink
- Report Inappropriate Content
group the data based on symbols you are using in sample chart you want to achieve.
as performance wise,maybe only one expression with if else statement with one symbol only and different colours for each milestone.
- Mark as New
- Bookmark
- Subscribe
- Mute
- Subscribe to RSS Feed
- Permalink
- Report Inappropriate Content
Hello Jonty,
Came across the post and I have a similar case. For the second expression, I have added a symbol the expression but it does not appear on the bar of first expression and appears rather below it.
How can it be on the bar of the first expression please? Thank you.
- « Previous Replies
-
- 1
- 2
- Next Replies »