Unlock a world of possibilities! Login now and discover the exclusive benefits awaiting you.
- Qlik Community
- :
- All Forums
- :
- QlikView App Dev
- :
- Re: Bar and Line char (Combo Char)
- Subscribe to RSS Feed
- Mark Topic as New
- Mark Topic as Read
- Float this Topic for Current User
- Bookmark
- Subscribe
- Mute
- Printer Friendly Page
- Mark as New
- Bookmark
- Subscribe
- Mute
- Subscribe to RSS Feed
- Permalink
- Report Inappropriate Content
Bar and Line char (Combo Char)
Dear All
Hope you can help with this,
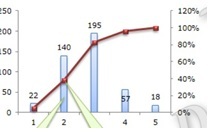
i need to show a combo chart as the attached image suppose i have:
Age bracket as dimension
Bar Chart that show the volume of deposits by brackets and the line chart that is an accumulation Percentage as picture attached
thanks
- Mark as New
- Bookmark
- Subscribe
- Mute
- Subscribe to RSS Feed
- Permalink
- Report Inappropriate Content
Simple  First the chart type should me combo chart then. Go to Chart Properties > Expression > choose the line expression and then in the bottom enable both the line and Symbol for this expression and choose the symbol format you want
Hope this helps you
- Mark as New
- Bookmark
- Subscribe
- Mute
- Subscribe to RSS Feed
- Permalink
- Report Inappropriate Content
Hi Mario,
Try this Attachment,
Susovan
- Mark as New
- Bookmark
- Subscribe
- Mute
- Subscribe to RSS Feed
- Permalink
- Report Inappropriate Content
Can you please send and qvw?
and if i need to show is exactly as the picture that i attached (Percentage is a cumulatative Percentage)
- Mark as New
- Bookmark
- Subscribe
- Mute
- Subscribe to RSS Feed
- Permalink
- Report Inappropriate Content
Hi Mario,
You could try "accumulation" option in Expression tab of the combo chart. Additionally, you could try
rangesum(above(sum(value), 0 , rowno())) as expression .
Best regards,
Kaveri
- Mark as New
- Bookmark
- Subscribe
- Mute
- Subscribe to RSS Feed
- Permalink
- Report Inappropriate Content
Hi,
Its very simple just enable Full accumulation in expressions tab for the line under chart Properties.
hope this is helpful
- Mark as New
- Bookmark
- Subscribe
- Mute
- Subscribe to RSS Feed
- Permalink
- Report Inappropriate Content
PFA
Susovan