Unlock a world of possibilities! Login now and discover the exclusive benefits awaiting you.
- Qlik Community
- :
- All Forums
- :
- QlikView App Dev
- :
- Bar chart FULL accumulation question
- Subscribe to RSS Feed
- Mark Topic as New
- Mark Topic as Read
- Float this Topic for Current User
- Bookmark
- Subscribe
- Mute
- Printer Friendly Page
- Mark as New
- Bookmark
- Subscribe
- Mute
- Subscribe to RSS Feed
- Permalink
- Report Inappropriate Content
Bar chart FULL accumulation question
Hi all,
I have a question that I hope someone can help.
I have the attached QV with two bar graphs showing the revenue evolution from January to March. First graph is showing revenues with NO Accumulation. Second graph is showing revenues with FULL Accumulation.
Data is showed as follows:
> Graph with NO Accumulation: January 3 usd / February 5 usd / March 4 usd
> Graph with FULL Accumulation: January 3 usd / February 8 usd (3+5) / March 12 usd (3+5+4)
The issue is: when I select February + March months from the List box, the bar chart with FULL Accumulation shows the following data
> February 5 usd / March 9 usd (5+4)
And actually what I'd expect is a graph showing:
> February 8 usd (3+5) / March 12 usd (3+5+4)
Can anyone help on that topic?
BR,
Dani
Accepted Solutions
- Mark as New
- Bookmark
- Subscribe
- Mute
- Subscribe to RSS Feed
- Permalink
- Report Inappropriate Content
For the 2nd Chart
Expression tab
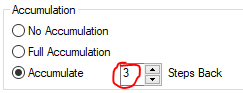
Tick No Accumulation
Now use below expression to get the accumulation using Expression
RangeSum(Above(Sum({<Period>}Amount),0,RowNo())) * Avg(1)
- Mark as New
- Bookmark
- Subscribe
- Mute
- Subscribe to RSS Feed
- Permalink
- Report Inappropriate Content
For the 2nd Chart
Expression tab
Tick No Accumulation
Now use below expression to get the accumulation using Expression
RangeSum(Above(Sum({<Period>}Amount),0,RowNo())) * Avg(1)
- Mark as New
- Bookmark
- Subscribe
- Mute
- Subscribe to RSS Feed
- Permalink
- Report Inappropriate Content
Hi
have you tried this
But I think as a good practice, you should try to do this as SET expression using Min & Max date ranges