Unlock a world of possibilities! Login now and discover the exclusive benefits awaiting you.
- Qlik Community
- :
- All Forums
- :
- QlikView App Dev
- :
- Bar chart Problem
- Subscribe to RSS Feed
- Mark Topic as New
- Mark Topic as Read
- Float this Topic for Current User
- Bookmark
- Subscribe
- Mute
- Printer Friendly Page
- Mark as New
- Bookmark
- Subscribe
- Mute
- Subscribe to RSS Feed
- Permalink
- Report Inappropriate Content
Bar chart Problem
Hi friends,
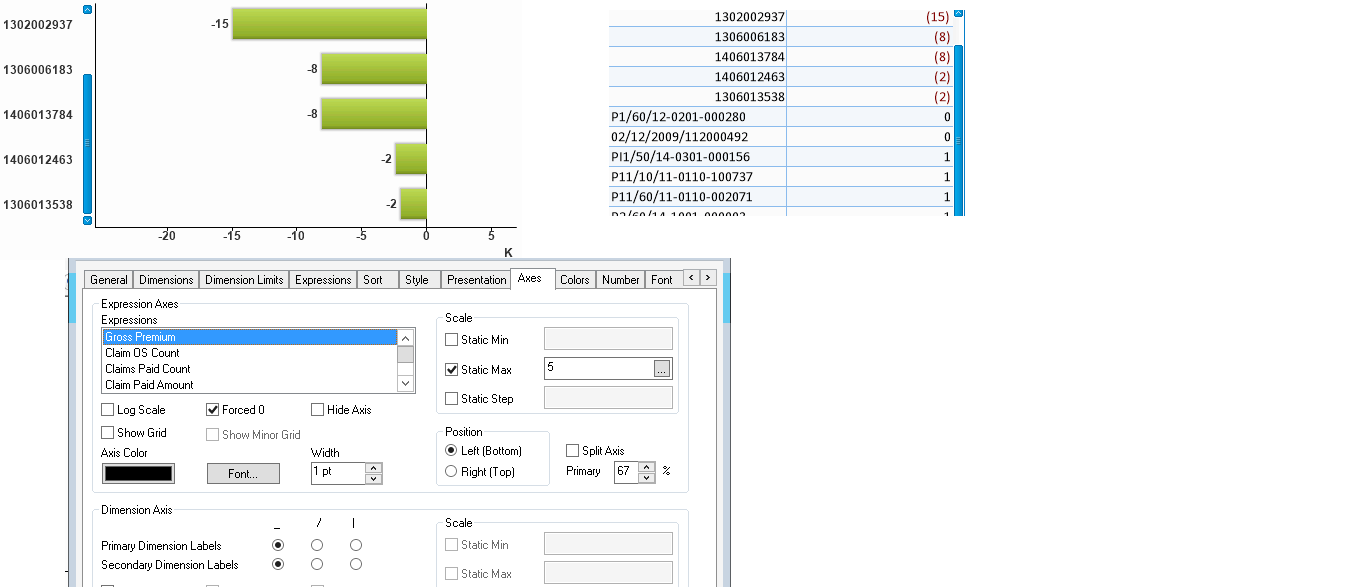
In my bar chart i need to show bottom 20 customers.In this i have both positive and Negative values.My chart is showing only negative values but not positive values.I set Static Max also.But no luck.Please find the attachment.
Any help will be appreciated .
Thanks in Advance.
Regards
Krishna
- Tags:
- new_to_qlikview
- « Previous Replies
- Next Replies »
Accepted Solutions
- Mark as New
- Bookmark
- Subscribe
- Mute
- Subscribe to RSS Feed
- Permalink
- Report Inappropriate Content
Hi Krishna, in the graph you have "Supress Zero Values" checked. Dimension Limit, Rank and RowNo() will count all this "0" values even if they aren´t show in the chart, so te remaining policies not showing are those which have a sum()=0.
If you want to remove the policies with value 0 you can change the fields in the group to a calculated dimension:
Policy No: =Aggr(Only({<TP_POLICY_NO={"=sum({<TP_TXN_TYPE={POL}>}TP_GrossPremium_LC_1)<>0"}>} TP_POLICY_NO), TP_POLICY_NO)
Company: =Aggr(Only({<COMP_NAME={"=sum({<TP_TXN_TYPE={POL}>}TP_GrossPremium_LC_1)<>0"}>} COMP_NAME), COMP_NAME)
This way dimension limit will filter the values previously filtered by the calculated dimension.
- Mark as New
- Bookmark
- Subscribe
- Mute
- Subscribe to RSS Feed
- Permalink
- Report Inappropriate Content
pls share some sample data
- Mark as New
- Bookmark
- Subscribe
- Mute
- Subscribe to RSS Feed
- Permalink
- Report Inappropriate Content
Hello Manoj,
Please check once the Y axis (Expression values) If there is huge data difference in -ve & +ve valuse it will not display.
- Mark as New
- Bookmark
- Subscribe
- Mute
- Subscribe to RSS Feed
- Permalink
- Report Inappropriate Content
Hi Krishna,
I suggest you to change that to a straight table and see if the data is coming as expected. Then you can corner bar chart for the correct result.
Cheers,
Naresh
- Mark as New
- Bookmark
- Subscribe
- Mute
- Subscribe to RSS Feed
- Permalink
- Report Inappropriate Content
Hi Naresh,
Please find the attachment , in that i'm showing both straight table and bar chart result as well as properties snapshot.
Regards
Krishna
- Mark as New
- Bookmark
- Subscribe
- Mute
- Subscribe to RSS Feed
- Permalink
- Report Inappropriate Content
Hi Krishna,
As per my understanding of this issue, you want to show only bottom 20 customers in bar chart. If we consider +ve and -ve Values, the customers with most -ve value will be the bottom customer. heance if you sort a bar chart with expression Descending order the largest negative value customer will be displayed 1st.
For Generating required output.
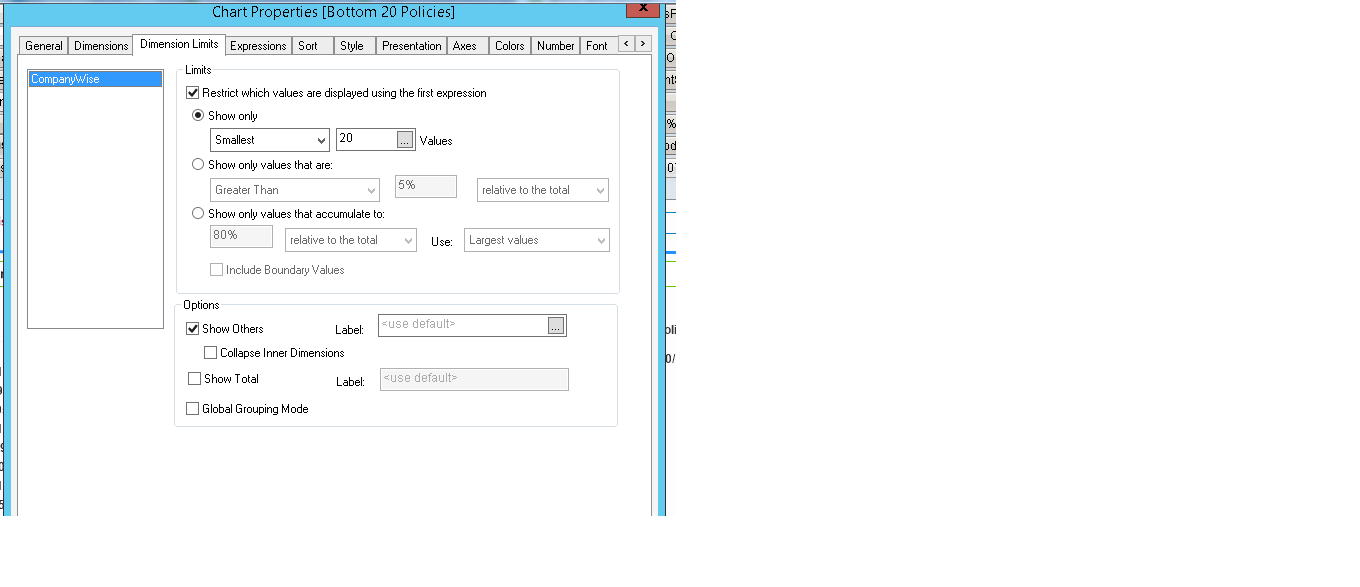
Go to Dimension Limits in chart properties -> select Customer Dimension -> check the Option of Restrict which values are displayed using the first expression -> check radio box SHOW ONLY -> select drop down option of Smallest -> Mention 20 in Text box( for showing bottom 20 customers).
I think above procedure may solve the required issue.
Regards,
Kiran
8976977897
- Mark as New
- Bookmark
- Subscribe
- Mute
- Subscribe to RSS Feed
- Permalink
- Report Inappropriate Content
Ok fine. Hope you have checked if Dimension Limits is enabled. I don't see any other issue apart from this.
Cheers,
Naresh
- Mark as New
- Bookmark
- Subscribe
- Mute
- Subscribe to RSS Feed
- Permalink
- Report Inappropriate Content
Hi Naresh,
Pls find the Dimension Limits screen shot which i used .Is there any wrong in this and guide further.
Regards
Krishna
- Mark as New
- Bookmark
- Subscribe
- Mute
- Subscribe to RSS Feed
- Permalink
- Report Inappropriate Content
Uncheck the option of Show others
- Mark as New
- Bookmark
- Subscribe
- Mute
- Subscribe to RSS Feed
- Permalink
- Report Inappropriate Content
Thanks Krishna.
Please try using Largest and check if you are able to see the positive values.
I doubt as there are zeros in your data, the negative and 0 values are counting up to 20 (which you have given in the dimension limits) and so no positive values are coming up.
Or you can change that to some 40 in Dimension Limits and check.
I am unable to see the full image of your bar chart as there is a scroll bar. Show Others check box should be showing you the sum of all positive values.
Cheers,
Naresh
- « Previous Replies
- Next Replies »