Unlock a world of possibilities! Login now and discover the exclusive benefits awaiting you.
- Qlik Community
- :
- All Forums
- :
- QlikView App Dev
- :
- Re: Bar chart Problem
- Subscribe to RSS Feed
- Mark Topic as New
- Mark Topic as Read
- Float this Topic for Current User
- Bookmark
- Subscribe
- Mute
- Printer Friendly Page
- Mark as New
- Bookmark
- Subscribe
- Mute
- Subscribe to RSS Feed
- Permalink
- Report Inappropriate Content
Bar chart Problem
Hi friends,
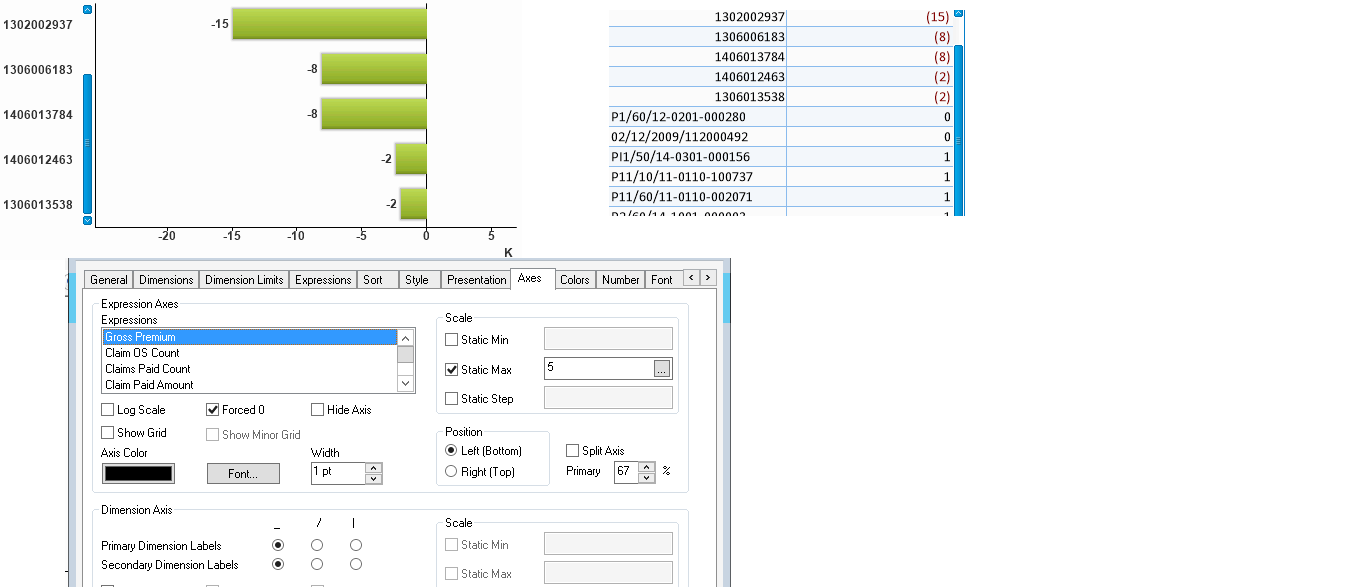
In my bar chart i need to show bottom 20 customers.In this i have both positive and Negative values.My chart is showing only negative values but not positive values.I set Static Max also.But no luck.Please find the attachment.
Any help will be appreciated .
Thanks in Advance.
Regards
Krishna
- Tags:
- new_to_qlikview
- Mark as New
- Bookmark
- Subscribe
- Mute
- Subscribe to RSS Feed
- Permalink
- Report Inappropriate Content
Hi Naresh,
I checked all the possibilities which we can do Prospectively .But No luck. Then only i approached our friends, not able to find where is the minute mistake or we need to apply any settings.
Regards
Krishna
- Mark as New
- Bookmark
- Subscribe
- Mute
- Subscribe to RSS Feed
- Permalink
- Report Inappropriate Content
Hi all ,
Sorry I forgot to say one thing here.I took dimension as drill down which is combo of company and policy No.
.Its working in straight table not in Bar chart.
Regards
Krishna
- Mark as New
- Bookmark
- Subscribe
- Mute
- Subscribe to RSS Feed
- Permalink
- Report Inappropriate Content
This is interesting.
Can you share your qvw with all the other tables dropped, script removed and the charts deleted except the straight table and the bar chart.
Cheers,
Naresh
- Mark as New
- Bookmark
- Subscribe
- Mute
- Subscribe to RSS Feed
- Permalink
- Report Inappropriate Content
Hi Kiran,
Thank you for the response,
I have applied the above procedure only.Please find the second screen shot and kindly let me know if anything is missing from your steps.
Regards
Krishna
- Mark as New
- Bookmark
- Subscribe
- Mute
- Subscribe to RSS Feed
- Permalink
- Report Inappropriate Content
Hi Krishna,
You are using Drill-down dimension as Company -> Policy No. or Company&'-'&Policy No.
In 1st Scenarion, if you are at Company level then it may be working.
but in 2nd scnearion, you need to bypass policy No using set analysis in expression
Regards,
Kiran
- Mark as New
- Bookmark
- Subscribe
- Mute
- Subscribe to RSS Feed
- Permalink
- Report Inappropriate Content
Hi Krishna,
I have not seen any sample attachment, request you to please share and if possible the output which will make more clear to understand the issue.
- Mark as New
- Bookmark
- Subscribe
- Mute
- Subscribe to RSS Feed
- Permalink
- Report Inappropriate Content
Hi All,
I'm attaching sample file here, Please watch it and suggest me .It's an important one for me.
Regards
Krishna
- Mark as New
- Bookmark
- Subscribe
- Mute
- Subscribe to RSS Feed
- Permalink
- Report Inappropriate Content
Hi All,
Is there any chance to solve it?
Regards
Krishna
- Mark as New
- Bookmark
- Subscribe
- Mute
- Subscribe to RSS Feed
- Permalink
- Report Inappropriate Content
Hi Krishna,
The answer is there in one my previous replies above
"I doubt as there are zeros in your data, the negative and 0 values are counting up to 20 (which you have given in the dimension limits) and so no positive values are coming up."
Just go to Presentation and Uncheck "Suppress Zero-Values" and check Zero on Bars. You'll be able to see all the 20 values and most of them are zeros and that is the reason the bar chart is not showing anything till now.
Cheers,
Naresh
- Mark as New
- Bookmark
- Subscribe
- Mute
- Subscribe to RSS Feed
- Permalink
- Report Inappropriate Content
Hi Krishna, in the graph you have "Supress Zero Values" checked. Dimension Limit, Rank and RowNo() will count all this "0" values even if they aren´t show in the chart, so te remaining policies not showing are those which have a sum()=0.
If you want to remove the policies with value 0 you can change the fields in the group to a calculated dimension:
Policy No: =Aggr(Only({<TP_POLICY_NO={"=sum({<TP_TXN_TYPE={POL}>}TP_GrossPremium_LC_1)<>0"}>} TP_POLICY_NO), TP_POLICY_NO)
Company: =Aggr(Only({<COMP_NAME={"=sum({<TP_TXN_TYPE={POL}>}TP_GrossPremium_LC_1)<>0"}>} COMP_NAME), COMP_NAME)
This way dimension limit will filter the values previously filtered by the calculated dimension.