Unlock a world of possibilities! Login now and discover the exclusive benefits awaiting you.
- Qlik Community
- :
- All Forums
- :
- QlikView App Dev
- :
- Re: Bar chart With Two dimension
- Subscribe to RSS Feed
- Mark Topic as New
- Mark Topic as Read
- Float this Topic for Current User
- Bookmark
- Subscribe
- Mute
- Printer Friendly Page
- Mark as New
- Bookmark
- Subscribe
- Mute
- Subscribe to RSS Feed
- Permalink
- Report Inappropriate Content
Bar chart With Two dimension
Hi All,
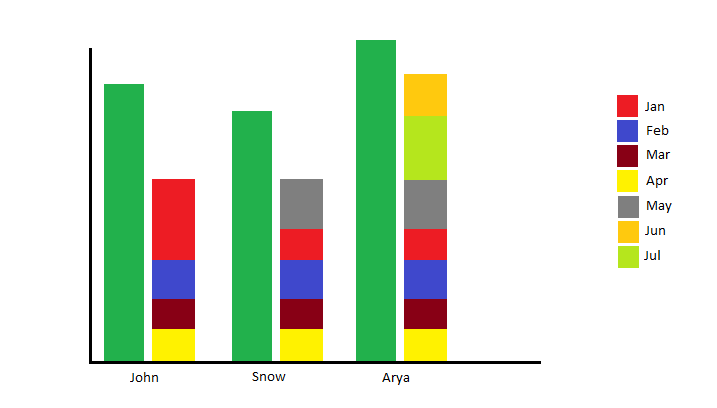
I want to create a bar chart with 2 dimension & two expression. One expression should be stacked sub type & other expression should be grouped subtype.
Any help would be appreciated.
- « Previous Replies
-
- 1
- 2
- Next Replies »
- Mark as New
- Bookmark
- Subscribe
- Mute
- Subscribe to RSS Feed
- Permalink
- Report Inappropriate Content
PFA contains the application as well as data..
- Mark as New
- Bookmark
- Subscribe
- Mute
- Subscribe to RSS Feed
- Permalink
- Report Inappropriate Content
This Chart is OK but my requirement is different
I have:
1)Annual plan year wise for salesman
2)Actual Plan month wise for salesman
I want All month grouped into a single bar & another bar for Annual Plan
- Mark as New
- Bookmark
- Subscribe
- Mute
- Subscribe to RSS Feed
- Permalink
- Report Inappropriate Content
Could you please add your application sample to understand me your requirement.
- Mark as New
- Bookmark
- Subscribe
- Mute
- Subscribe to RSS Feed
- Permalink
- Report Inappropriate Content
PFA content.
I want both the chart to be combine.
- Mark as New
- Bookmark
- Subscribe
- Mute
- Subscribe to RSS Feed
- Permalink
- Report Inappropriate Content
Any solution guys???
- Mark as New
- Bookmark
- Subscribe
- Mute
- Subscribe to RSS Feed
- Permalink
- Report Inappropriate Content
Hi,
See attachment.
- Mark as New
- Bookmark
- Subscribe
- Mute
- Subscribe to RSS Feed
- Permalink
- Report Inappropriate Content
Hi Prashant,
Try like this
Script:
----------
Tab1:
LOAD Salesman,
Month,
Actual AS Value,
1 AS Category
FROM
[Budget.xlsx]
(ooxml, embedded labels, table is Sheet1);
Tab1:
LOAD Salesman,
Month,
[Annual Plan] AS Value,
2 AS Category
FROM
[Budget.xlsx]
(ooxml, embedded labels, table is Sheet1);
Now in chart use
Dimension : Salesman, Category
Expression1:=Sum({<Category={2}>}Actual)
Expression2:=sum({$<Category={1}, Month={Jan}>} Actual)
Expression3:=sum({$<Category={1}, Month={Feb}>} Actual)
Expression4:=sum({$<Category={1}, Month={Mar}>} Actual)
Expression5:=sum({$<Category={1}, Month={Apr}>} Actual)
Hope this helps you.
Regards,
Jagan.
- « Previous Replies
-
- 1
- 2
- Next Replies »