Unlock a world of possibilities! Login now and discover the exclusive benefits awaiting you.
- Qlik Community
- :
- All Forums
- :
- QlikView App Dev
- :
- Bar chart axes shows same month multiple time on a...
- Subscribe to RSS Feed
- Mark Topic as New
- Mark Topic as Read
- Float this Topic for Current User
- Bookmark
- Subscribe
- Mute
- Printer Friendly Page
- Mark as New
- Bookmark
- Subscribe
- Mute
- Subscribe to RSS Feed
- Permalink
- Report Inappropriate Content
Bar chart axes shows same month multiple time on a particular selection but no repetitive value on some other value
Hi,
Any help / guidance on following scenario will be great.
I've bar chart that shows bars for multiple dimensional values. In that scenario the timeline behaves nicely and I don't get repetitive values for months. As can be seen in following screen shot.

When I select a particular single value it behaves correctly in following screen shot ....

..... but not in the one selected in next screen shot. I'm trying to find clues for such behavior

I've included Data File for reference
Axes formula
Static Min
=If(GetSelectedCount([Counterparty Document: Document ID]) = 1,
Min({<[Counterparty Document: Document ID]={"$(vGetSelectedCPDocID)"}, [TL Sequence]={"$(vMinSeqNoForSelectedDoc)"}>}[TL Start Date Time]) - 15,
Min({<[Counterparty Document: Document ID]>}[TL Start Date Time]) - 15)
Static Max
=If(GetSelectedCount([Counterparty Document: Document ID]) = 1,
Max({<[Counterparty Document: Document ID]={"$(vGetSelectedCPDocID)"}, [TL Sequence]={"$(vMaxSeqNoForSelectedDoc)"}>}[TL End Date Time]) + 15,
Max({<[Counterparty Document: Document ID]>}[TL End Date Time]) + 15)
Thanks in advance.
Regards,
Vijay
- Mark as New
- Bookmark
- Subscribe
- Mute
- Subscribe to RSS Feed
- Permalink
- Report Inappropriate Content
Hi,
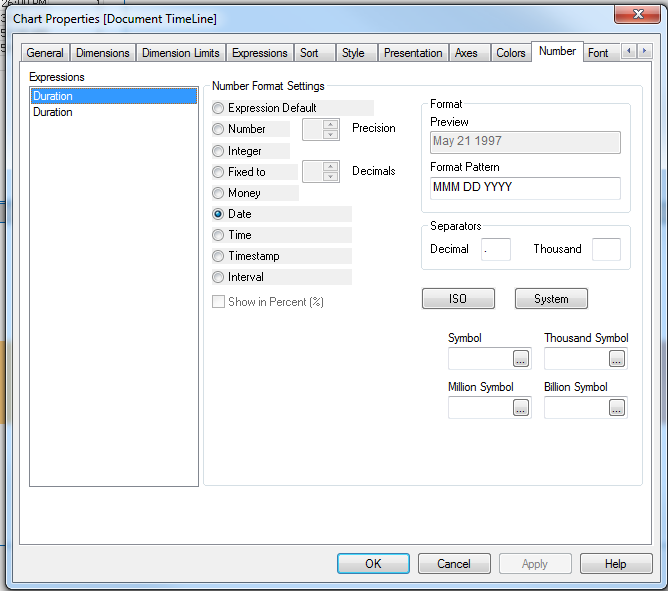
The issue was axes number format. I had MMM YYYY, once I changed it to MMM DD YYYY, the behavior looks fine as can be seen from screen shots below.


