Unlock a world of possibilities! Login now and discover the exclusive benefits awaiting you.
Announcements
Save $650 on Qlik Connect, Dec 1 - 7, our lowest price of the year. Register with code CYBERWEEK: Register
- Qlik Community
- :
- All Forums
- :
- QlikView App Dev
- :
- Re: Bar chart display top 5 positive and negative ...
Options
- Subscribe to RSS Feed
- Mark Topic as New
- Mark Topic as Read
- Float this Topic for Current User
- Bookmark
- Subscribe
- Mute
- Printer Friendly Page
Turn on suggestions
Auto-suggest helps you quickly narrow down your search results by suggesting possible matches as you type.
Showing results for
Creator
2019-01-16
10:14 AM
- Mark as New
- Bookmark
- Subscribe
- Mute
- Subscribe to RSS Feed
- Permalink
- Report Inappropriate Content
Bar chart display top 5 positive and negative values remaining should be under others
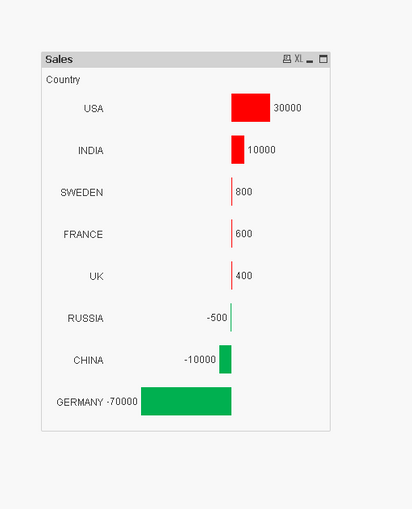
Hi Everyone,
Here is my input bar chat

Expected output:

Thanks,
Suresh V.V
1,215 Views
3 Replies
MVP
2019-01-16
10:19 AM
- Mark as New
- Bookmark
- Subscribe
- Mute
- Subscribe to RSS Feed
- Permalink
- Report Inappropriate Content
Try this
Dimension
=If(Match(Country, 'GERMANY', 'USA', 'INDIA', 'CHINA'), Country, 'OTHERS')
Expression
=Sum(Sales)
Sorting
Match(If(Match(Country, 'GERMANY', 'USA', 'INDIA', 'CHINA'), Country, 'OTHERS'), 'GERMANY', 'USA', 'INDIA', 'CHINA', 'OTHERS')
1,210 Views
Creator
2019-01-17
04:06 AM
Author
- Mark as New
- Bookmark
- Subscribe
- Mute
- Subscribe to RSS Feed
- Permalink
- Report Inappropriate Content
Hi Sunny,
Thanks for your quick response:),
The below Measures are not a static, Those are Dynamic
example: 1. For Jan-2019 (GERMANY,USA,INDIA,CHINA ) are Top 5
2. For Feb-2019 may be ( SWEDEN,RUSSIA,USA,UK) will be in top 5 (We are not sure which country will be in the top 5 every month)
Thanks,
Suresh V.V
1,191 Views
Creator
2019-01-21
04:46 AM
Author
- Mark as New
- Bookmark
- Subscribe
- Mute
- Subscribe to RSS Feed
- Permalink
- Report Inappropriate Content
Hi Guys,
Any suggestions here !
Thanks,
Suresh V.V
1,172 Views
