Unlock a world of possibilities! Login now and discover the exclusive benefits awaiting you.
- Qlik Community
- :
- All Forums
- :
- QlikView App Dev
- :
- Bar chart expression
- Subscribe to RSS Feed
- Mark Topic as New
- Mark Topic as Read
- Float this Topic for Current User
- Bookmark
- Subscribe
- Mute
- Printer Friendly Page
- Mark as New
- Bookmark
- Subscribe
- Mute
- Subscribe to RSS Feed
- Permalink
- Report Inappropriate Content
Bar chart expression
Hi All,
I want to show the Marks Categories,No of Students,Percentage values in a bar chart for the below table data.
| EMPNO | ENAME | MARKS |
| 7369 | SMITH | 35 |
| 7499 | ALLEN | 45 |
| 7521 | WARD | 89 |
| 7566 | JONES | 65 |
| 7654 | MARTIN | 76 |
| 7698 | BLAKE | 63 |
| 7782 | CLARK | 98 |
| 7788 | SCOTT | 95 |
| 7839 | KING | 41 |
| 7844 | TURNER | 53 |
| 7876 | ADAMS | 87 |
| 7900 | JAMES | 88 |
| 7902 | FORD | 92 |
| 7934 | MILLER | 56 |
| Marks Category | No of Students | Persontage |
| Below 40% | x | x |
| 40%-60% | x | x |
| 60% to 70% | x | x |
| Above 70% | x | x |
| Total | x | x |
- Tags:
- new_to_qlikview
Accepted Solutions
- Mark as New
- Bookmark
- Subscribe
- Mute
- Subscribe to RSS Feed
- Permalink
- Report Inappropriate Content
You can try something like attached
- Mark as New
- Bookmark
- Subscribe
- Mute
- Subscribe to RSS Feed
- Permalink
- Report Inappropriate Content
You can try something like attached
- Mark as New
- Bookmark
- Subscribe
- Mute
- Subscribe to RSS Feed
- Permalink
- Report Inappropriate Content
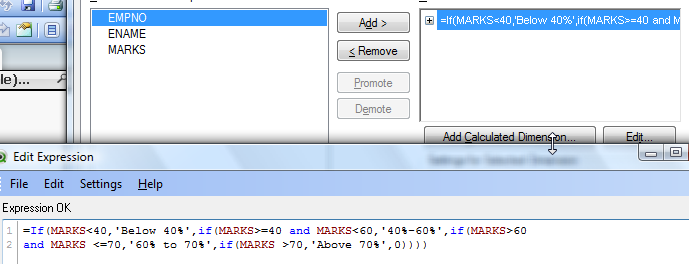
Create Calculated Dimension
=If(MARKS<40,'Below 40%',if(MARKS>=40 and MARKS<60,'40%-60%',if(MARKS>60 and MARKS <=70,'60% to 70%',if(MARKS >70,'Above 70%',0))))

Then Expression
Count(EMPNO)
Count(MARKS)/count(TOTAL MARKS)

- Mark as New
- Bookmark
- Subscribe
- Mute
- Subscribe to RSS Feed
- Permalink
- Report Inappropriate Content
Or you can create this in Script:
Directory;
LOAD EMPNO,
ENAME,
MARKS,
If(MARKS<40,'Below 40%',if(MARKS>=40 and MARKS<60,'40%-60%',if(MARKS>60 and MARKS <=70,'60% to 70%',if(MARKS >70,'Above 70%',0))))as Category
FROM
and the use Category as Dimension
To get the Total in Dimension Limit choose Show Total
![2015-04-15 05_27_01-Chart Properties [1].png](/legacyfs/online/83677_2015-04-15 05_27_01-Chart Properties [1].png)
- Mark as New
- Bookmark
- Subscribe
- Mute
- Subscribe to RSS Feed
- Permalink
- Report Inappropriate Content
Thank you all.